Practice problem
Symbiosis — Definition & Types
By Valeri Natole

+2 contributors
Contributors

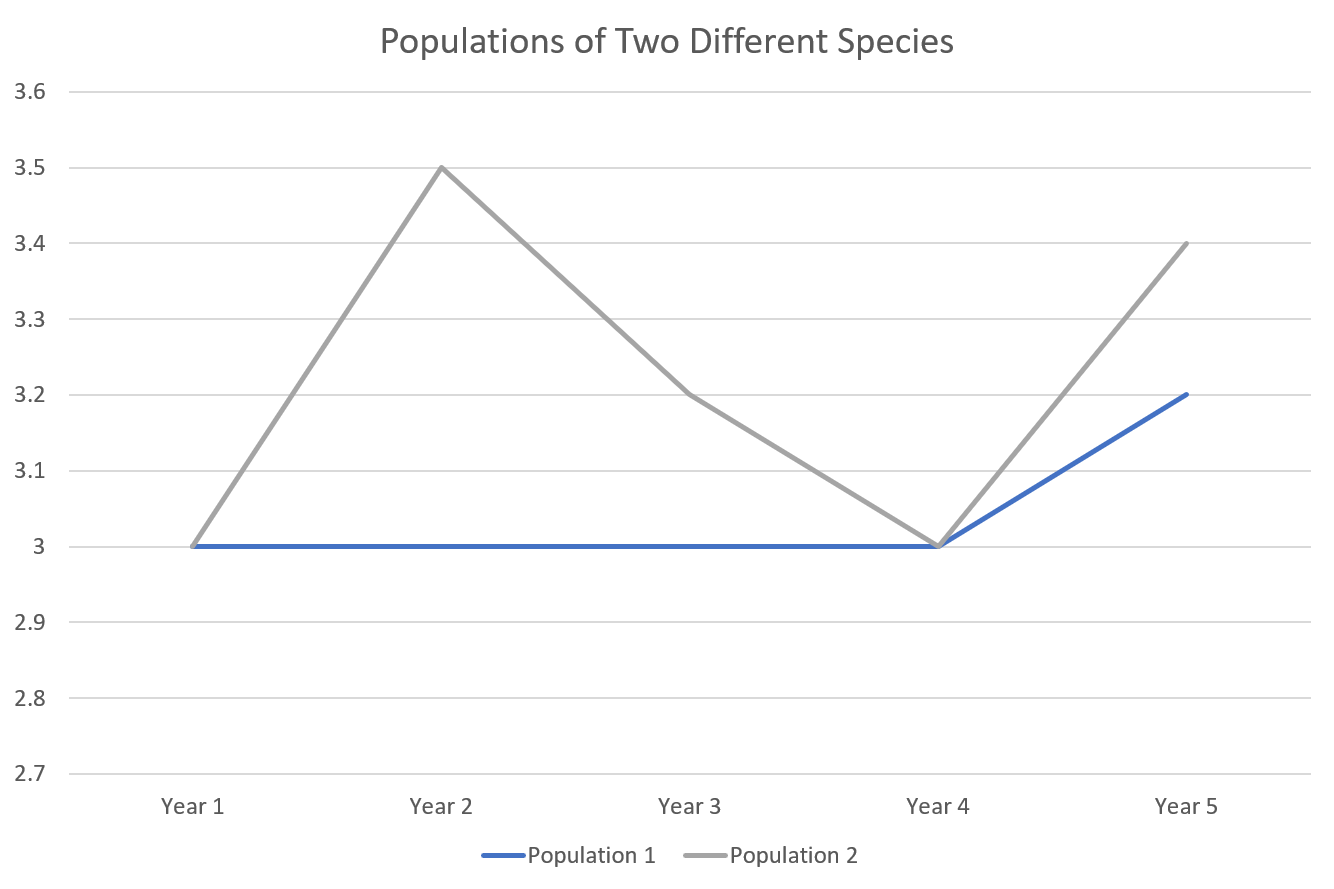
A graph showing population numbers, by the thousands, over 5 years.
Do these two species appear to be in a symbiotic relationship? Why or why not?
Practice problem
A graph showing population numbers, by the thousands, over 5 years.
Do these two species appear to be in a symbiotic relationship? Why or why not?