Practice problem
Limiting Factor (Populations) — Definition & Examples
By Valeri Natole

+1 contributors
Contributors

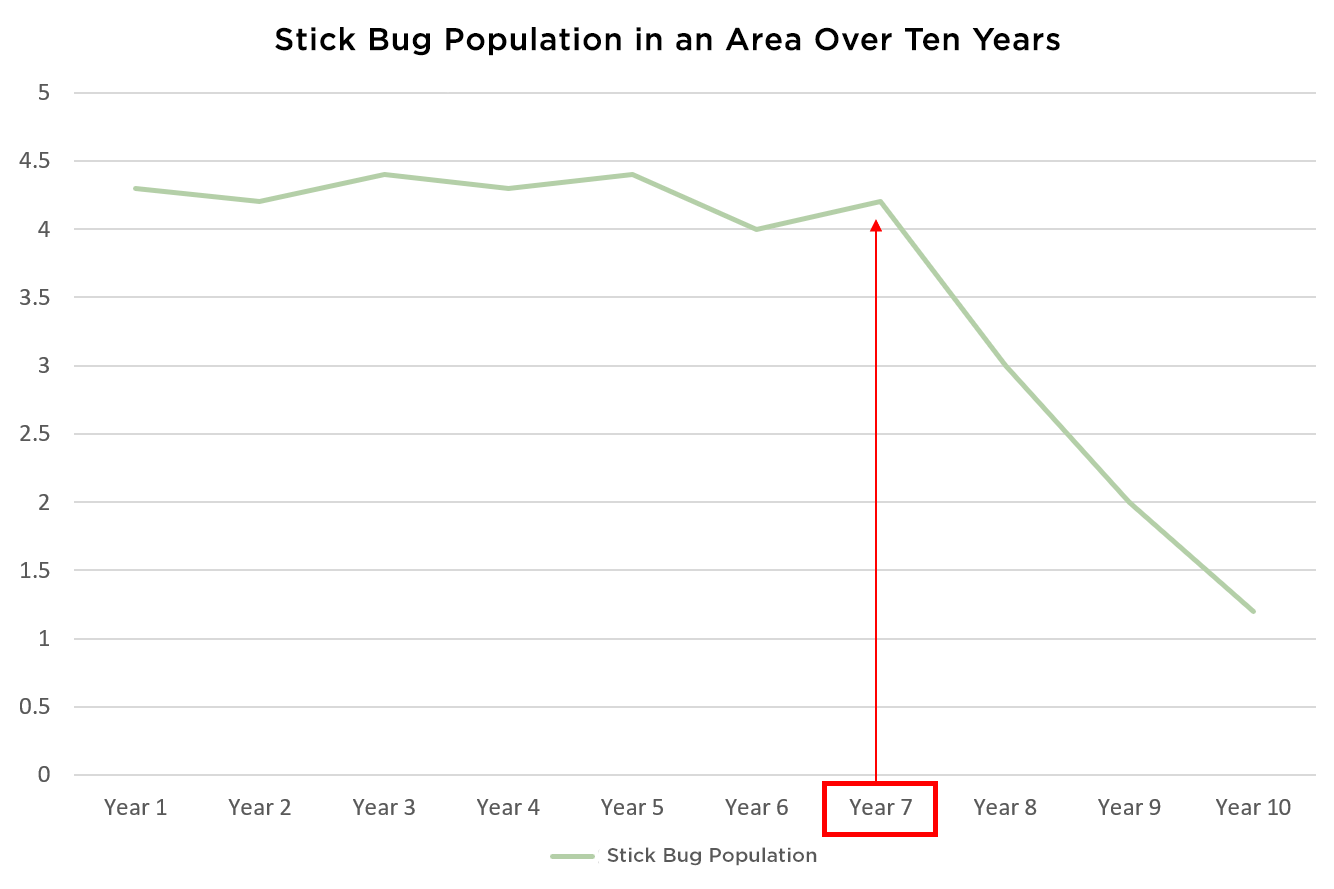
Stick-big population by the hundreds, over ten years.
What most likely happened in the 7th year?
Practice problem
Stick-big population by the hundreds, over ten years.
What most likely happened in the 7th year?