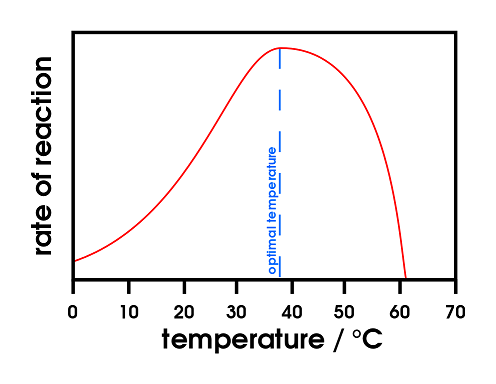
The graph shows the rate of a certain reaction at various temperatures. The rate increases from 0 degrees until it reaches the optimal temperature of 37 degrees. Then it rapidly decreases as the temperature keeps increasing, until it reaches 0 around 60 degrees.

Image source: By domdomegg (Own work) CC BY 2.0, via Wikimedia Commons

The graph above shows that a certain enzyme functions best at around 37 degrees Celsius. What happens if the temperature is raised to 55 degrees Celsius?

Choose one answer

Type a concept, like “slope” or “photosynthesis”.

↑ ↓ to choose · Enter to openSearch explanations and problems