Practice problem
Temperature (Enzyme Reaction Rates) — Effects & Examples
+1 contributors
Contributors

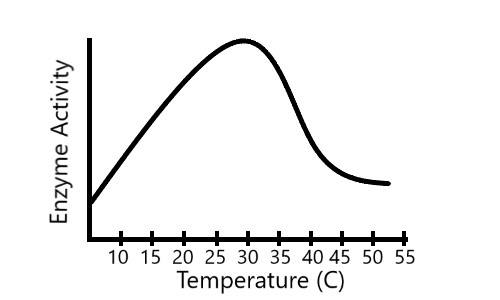
According to the graph above, what likely happened to the enzyme between 30C and 45C?
Practice problem
According to the graph above, what likely happened to the enzyme between 30C and 45C?