Practice problem
Temperature (Enzyme Reaction Rates) — Effects & Examples
By Valeri Natole

+2 contributors
Contributors


Take a look at this graph for a catalyzed reaction:
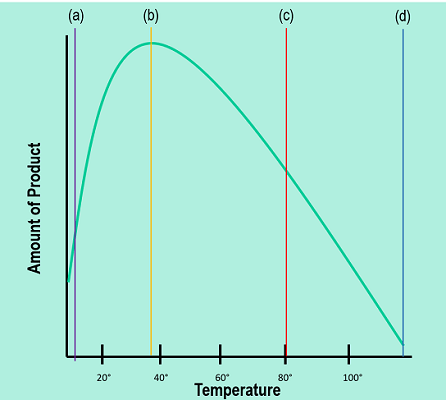
Which vertical line marks the optimal temperature of the catalyst?
Practice problem
Take a look at this graph for a catalyzed reaction:
Which vertical line marks the optimal temperature of the catalyst?