Practice problem
Cumulative Frequency Table
+3 contributors



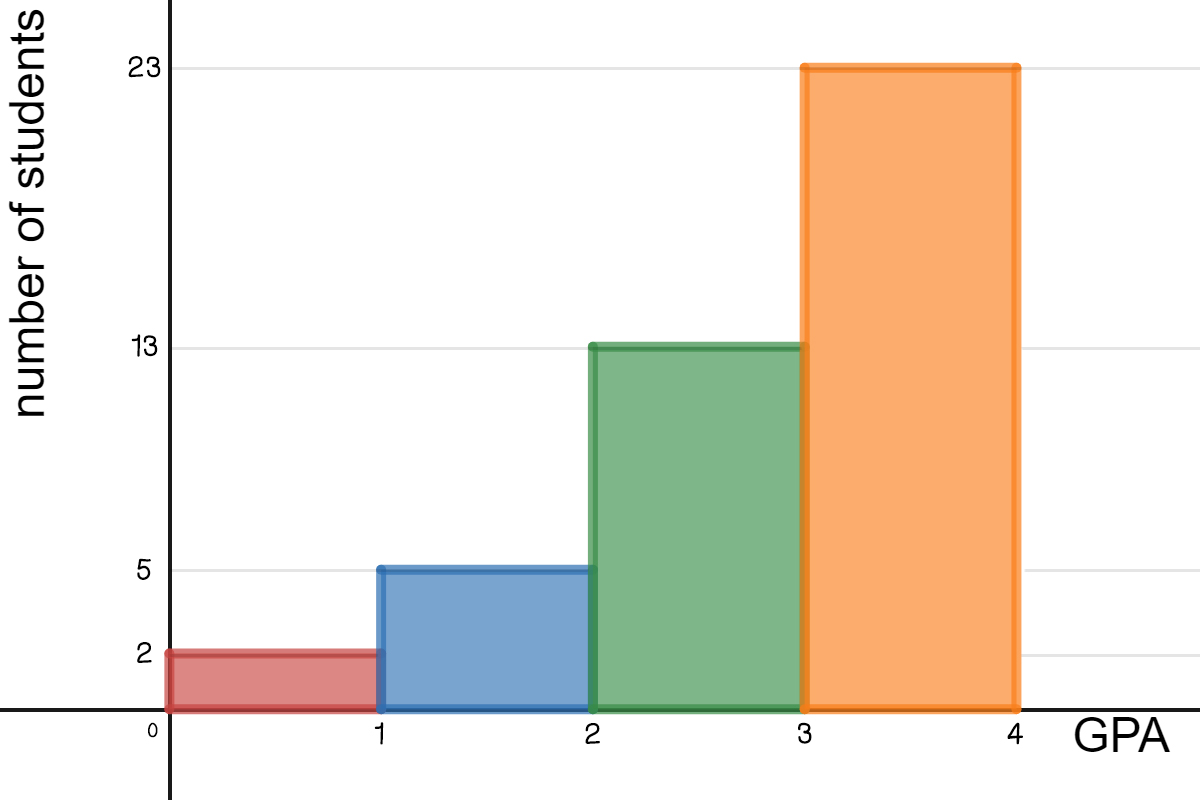
Image Source: Taylor Evans
Made using Desmos
Above is a histogram of the GPA of a class of students. If a student has a GPA of at least , they have a chance of receiving a scholarship from their school. How many students in this class may be eligible for the scholarship?