Practice problem
Measures of Central Tendency: Mode
+2 contributors
Contributors


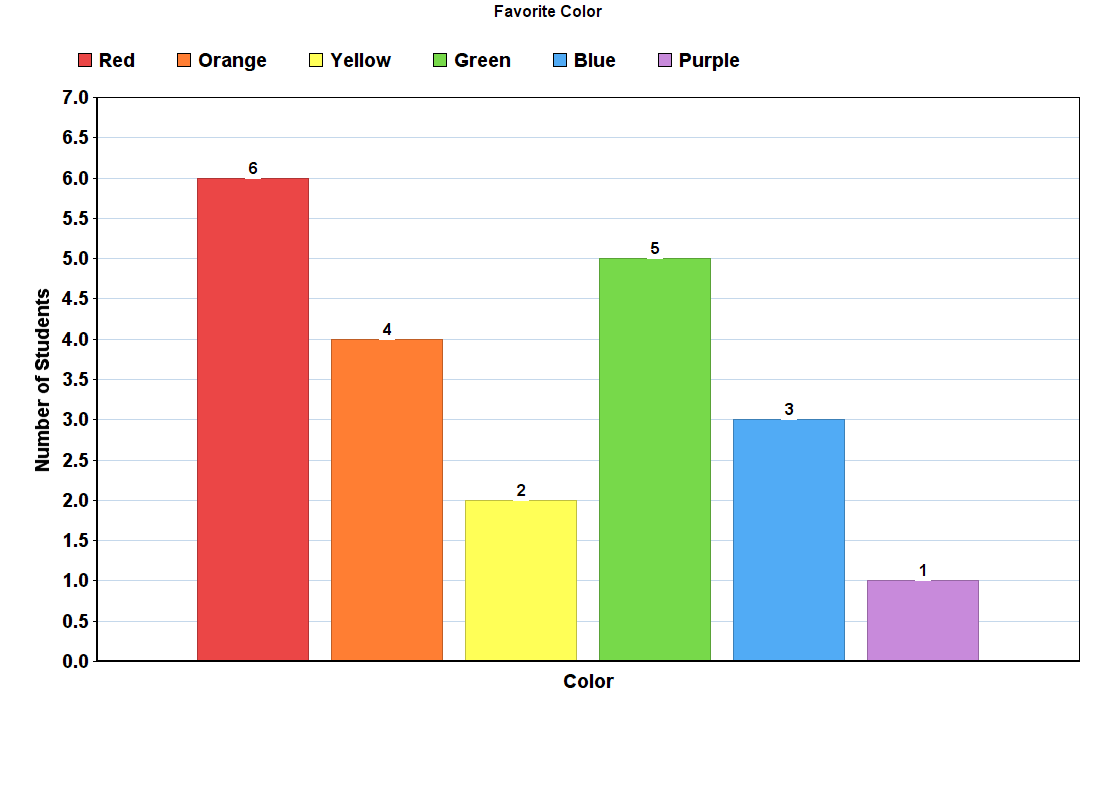
Image Source: Taylor Evans
Above are the result of a survey taken of children in a day care.
Which color is the mode?
Practice problem
Image Source: Taylor Evans
Above are the result of a survey taken of children in a day care.
Which color is the mode?