Practice problem
Polygenic — Definition & Examples

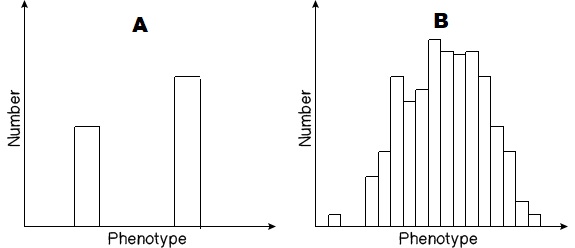
The graphs above depict phenotypes for different traits and the frequency with which they occur in a population. Which of the graphs likely shows a polygenic trait?
Practice problem
The graphs above depict phenotypes for different traits and the frequency with which they occur in a population. Which of the graphs likely shows a polygenic trait?