Practice problem
Tropical Biomes — Rainforest, Dry Forest & Savanna
By Gabi Slizewska

+1 contributors
Contributors

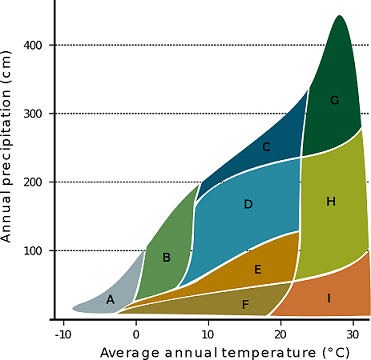
Image source: By Navarras CC BY 2.0, via Wikimedia Commons

The graph above shows different colored blocks which represent the range of temperatures and precipitation in different biomes. Which of the following is most likely represented by letter G?