Practice problem
Tropical Biomes — Rainforest, Dry Forest & Savanna
By Gabi Slizewska

+1 contributors
Contributors

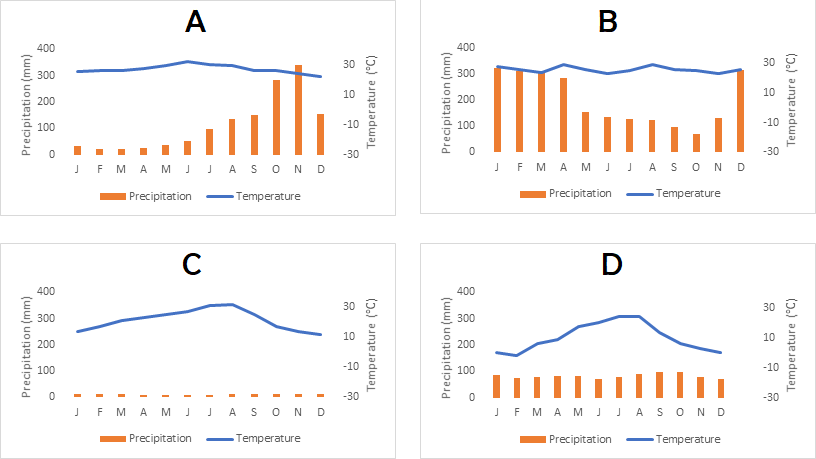
The graphs above show the average temperature and precipitation over the course of a year for four different biomes. Which graph matches a tropical rain forest biome?