Practice problem
Polar Biomes — Tundra & Taiga

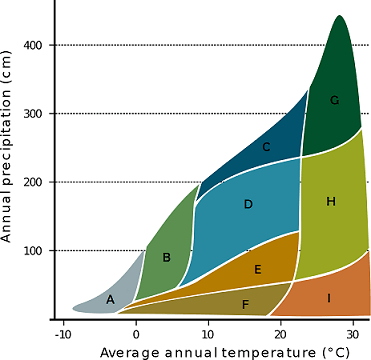
Image source: By Navarras CC BY 2.0, via Wikimedia Commons

The graph above shows the average annual temperature and precipitation ranges of different biomes. Which biome is represented by letter A?
Practice problem
Image source: By Navarras CC BY 2.0, via Wikimedia Commons
The graph above shows the average annual temperature and precipitation ranges of different biomes. Which biome is represented by letter A?