Practice problem
Desert Biomes — Semiarid, Coastal, Cold & Hot and Dry
By Gabi Slizewska

+1 contributors
Contributors

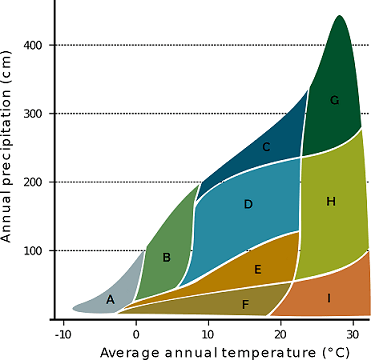
Image source: By Navarras CC BY 2.0, via Wikimedia Commons

The graph above shows the annual average temperature and precipitation for different biomes. Which of the following represents a desert biome?