Practice problem
Polar Biomes — Tundra & Taiga

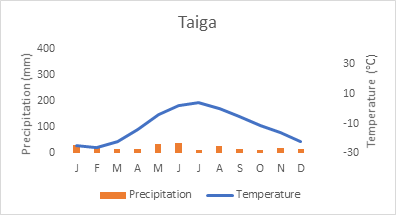
The graph above shows the average temperatures and precipitation throughout the year of a certain taiga biome. Based on this information, when do you think animals in this biome are most likely to reproduce?