Practice problem
Discrete Data - Defintion & Examples
By Alex Federspiel

+3 contributors


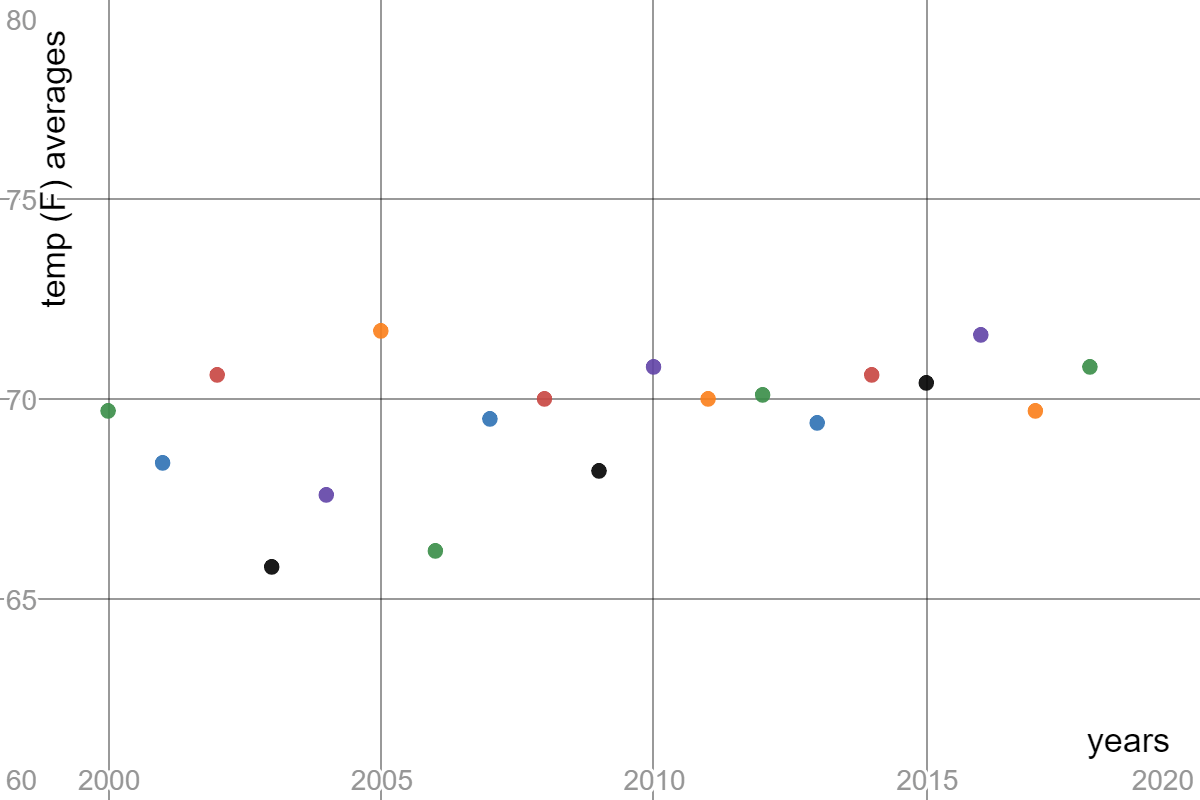
Made using Desmos
Above is the graph of the the average June temperatures in Pittsburgh from to If temperature is a continuous variable, why is the graph appearing discrete?