Practice problem
Normal Distribution: Right and Left Skewed Graphs
+1 contributors
Contributors

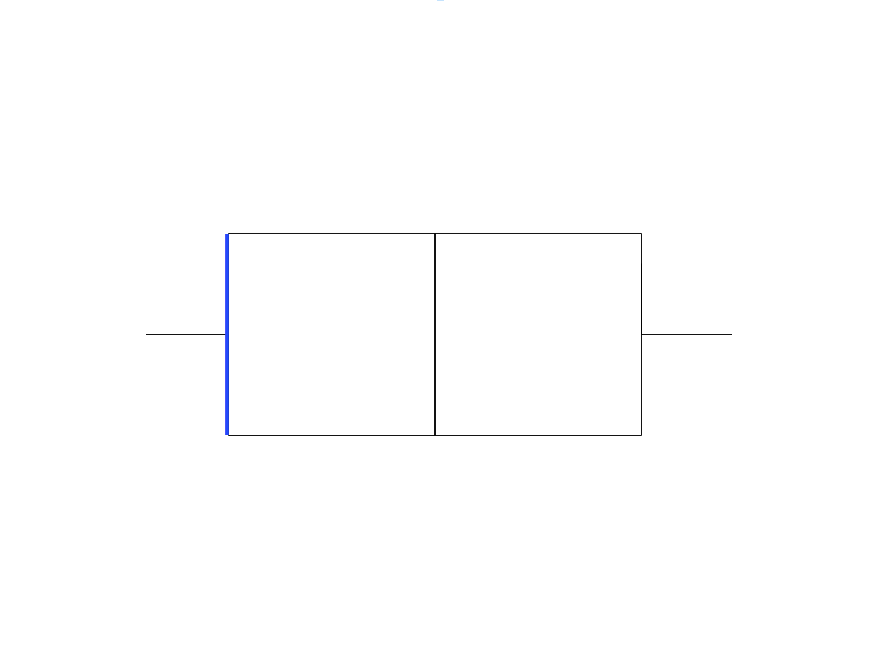
Graph created on Desmos
What does the blue line represent on the box plot shown above?
Practice problem
Graph created on Desmos
What does the blue line represent on the box plot shown above?