Practice problem
Image: https://support.minitab.com/en-us/minitab-express/1/help-and-how-to/basic-statistics/inference/supporting-topics/data-concepts/identifying-outliers/
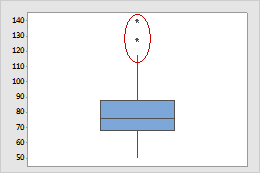
What do the stars in the red circle represent on the box-plot above?
Outliers
Whiskers
1st Quartile
3rd Quartile
None of the above
Not Enough Info
Type a concept, like “slope” or “photosynthesis”.