Practice problem
Scatter Plots - Definition & Examples
By Alex Federspiel

+1 contributors
Contributors

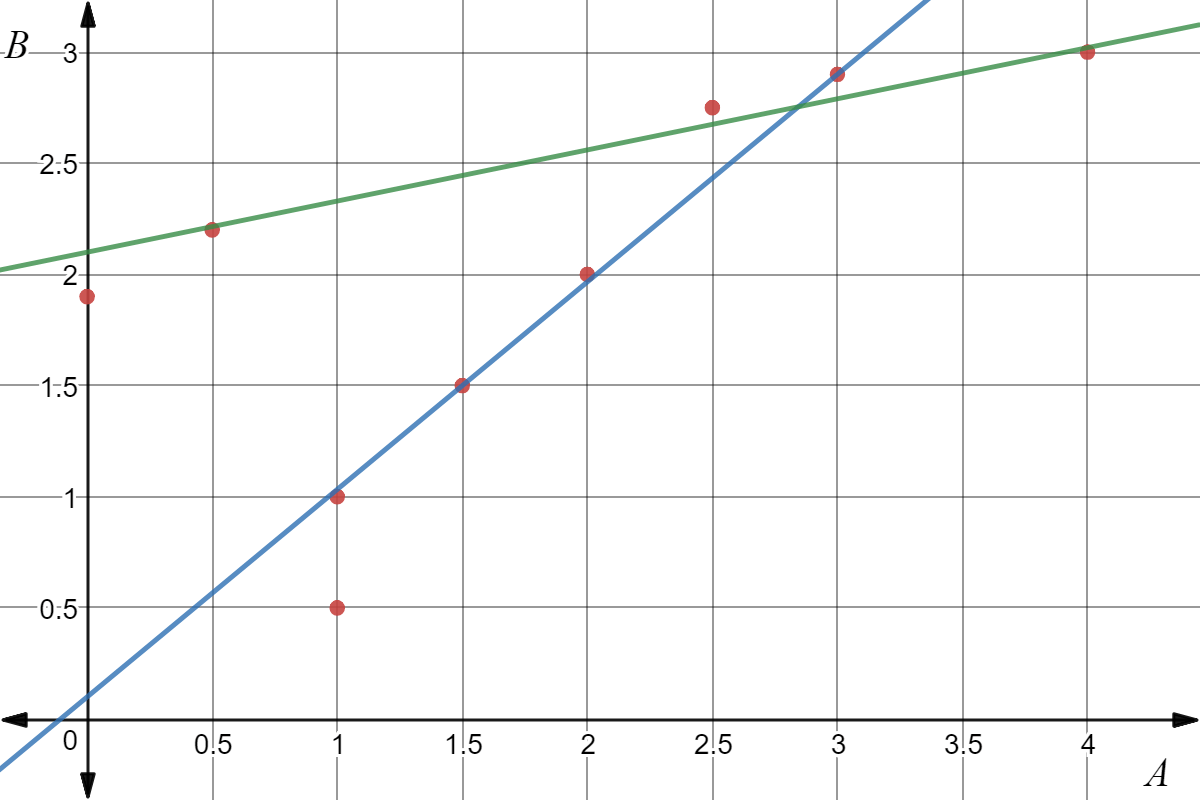
Made using Desmos
In the scatter plot above, what do the red points represent?
Practice problem
Made using Desmos
In the scatter plot above, what do the red points represent?