Practice problem
Scatter Plots - Definition & Examples
By Alex Federspiel

+1 contributors
Contributors

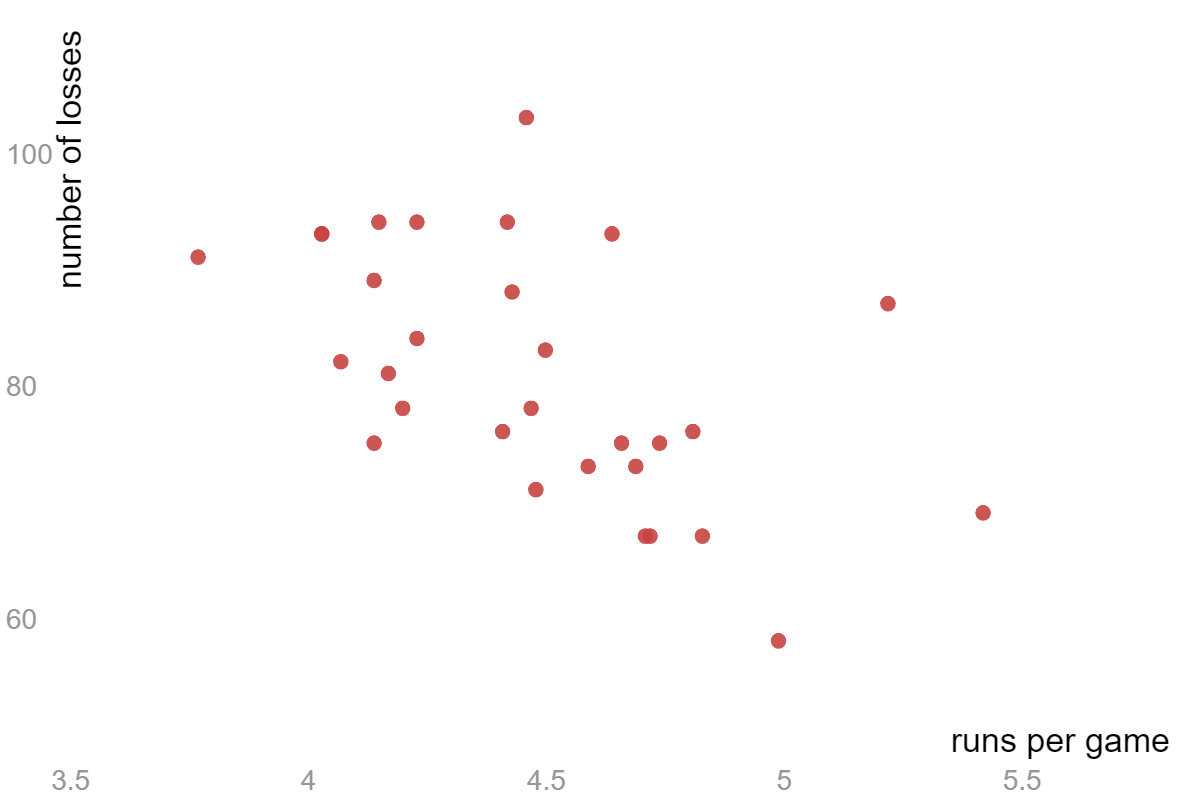
Made using Desmos
The scatter plot above shows different baseball teams' runs per game and number of losses.
What can we say about runs per game and the number of losses based off this graph?