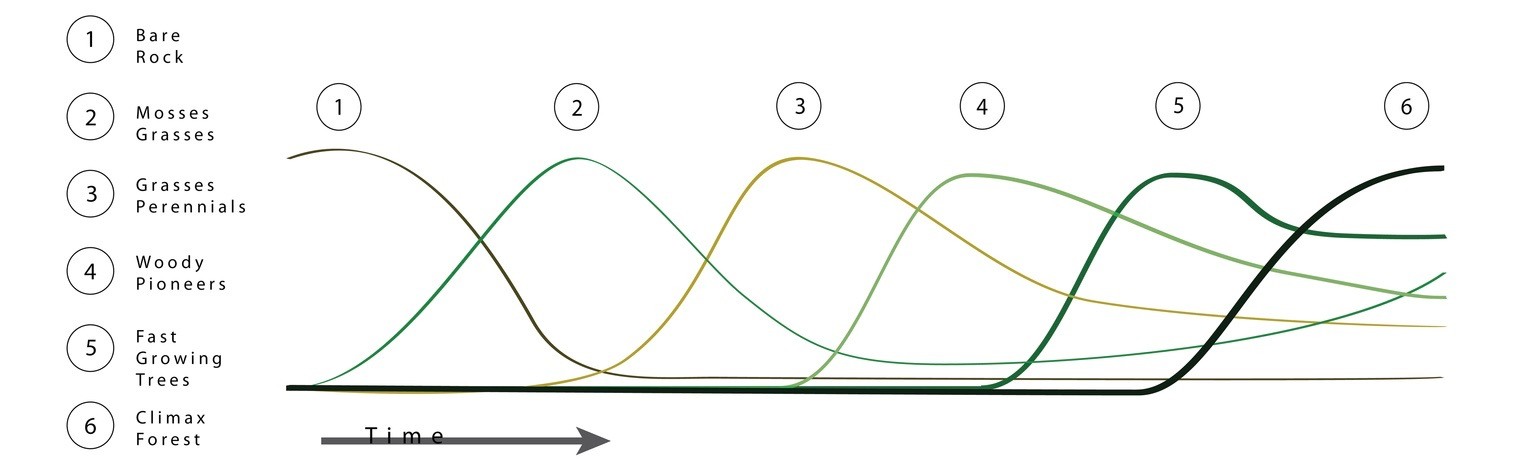
This is a chart that shows the population sizes of bare rock and 5 other species: 1. Mosses Grasses, 2. Grasses Perennials, 3. Woody Pioneers, 4. Fast Growing Trees, 5. Climax Forest. The graph starts with the number of bare rock starts at the highest quantity and then decreases. As the rock number decreases, the mosses grasses increases. Once mosses grass population reaches the same quantity of the rock number, the population of mosses decreases and then the grasses perennials population increases. This trend continues through all the 5 species. At the end of the graph, all the species population begin to plateau.

Image source: By LuscasMartinFrey CC BY 2.0, via Wikimedia Commons

Look at the chart above that describes succession over time. Which explanation best describes the trends seen in the chart?

Choose one answer

Type a concept, like “slope” or “photosynthesis”.

↑ ↓ to choose · Enter to openSearch explanations and problems