Practice problem
Normal Distribution: Right and Left Skewed Graphs

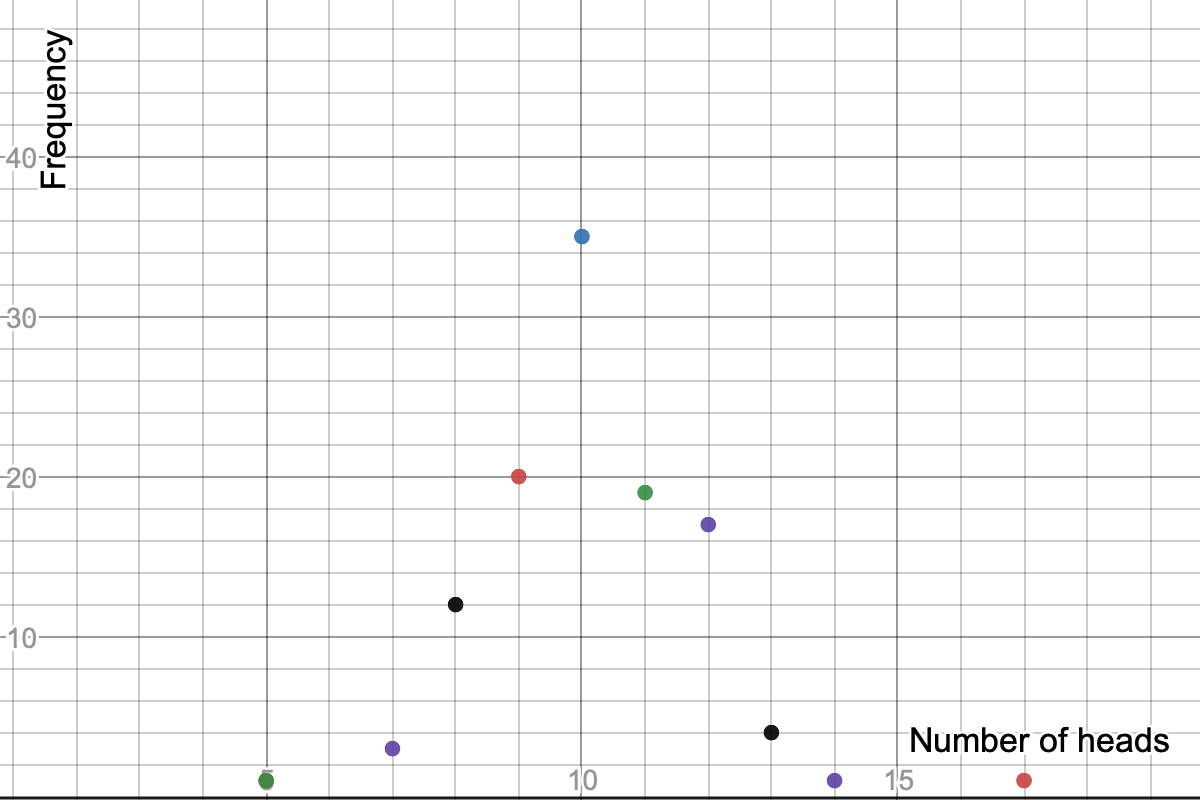
Graph created on Desmos
I ran an experiment times. The experiment is as follows: I flipped a fair coin times, and recorded the number of heads I got. The data from all the trials is shown above. Which is the best description of the data?