Practice problem
What Is a Histogram?
By Alex Federspiel

+1 contributors
Contributors

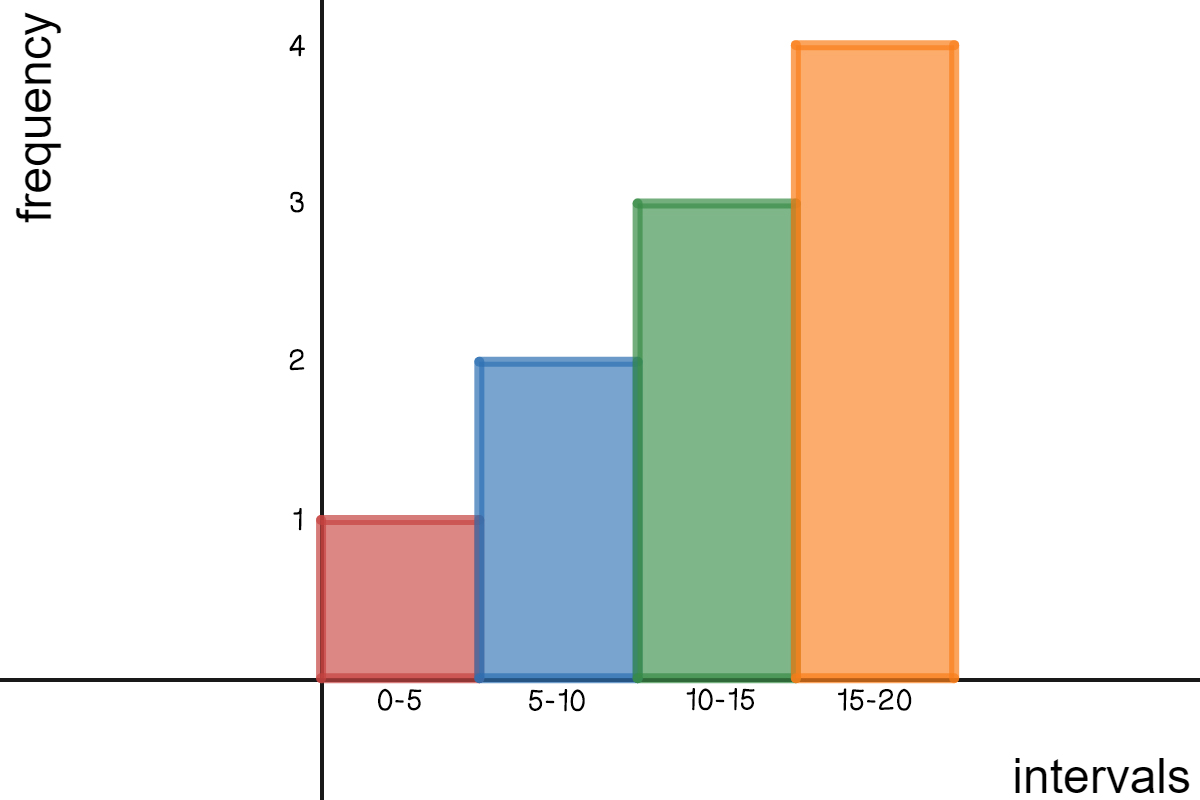
Made using Desmos
Above is a histogram. Which data set could be represented by this histogram?
Practice problem
Made using Desmos
Above is a histogram. Which data set could be represented by this histogram?