Practice problem

Scatter Plots: Correlation vs. Causation

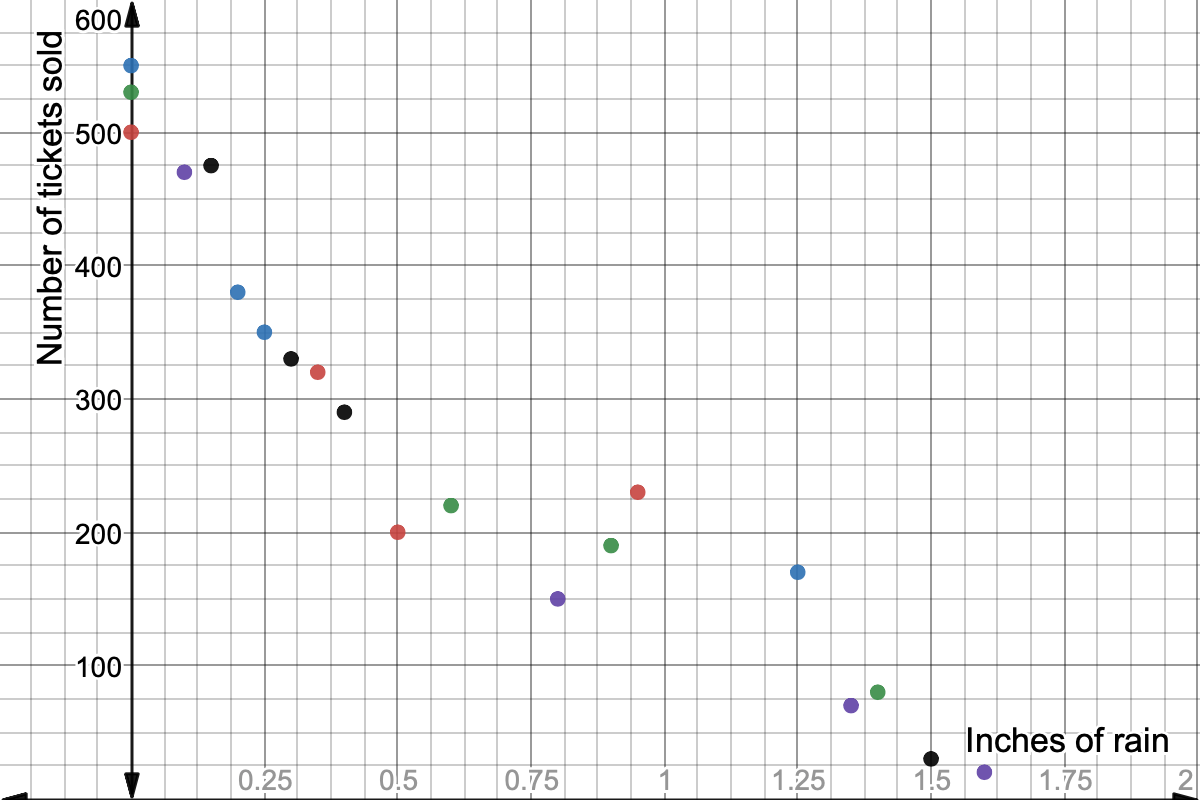
Coordinate points (inches of rain, number of tickets sold): (0.5, 200), (0.25, 350), (0.6, 220), (0.8, 150), (1.5, 30), (0, 500), (0, 550), (0, 530), (0.1, 470), (0.15, 475), (0.95, 230), (1.25, 170), (1.4, 80), (1.35, 70), (0.3, 330), (0.35, 320), (0.2, 380), (0.9, 190), (1.6, 20), (0.4, 290)

Graph courtesy of Desmos

For 2020 straight days the local jazz quartet held outdoor concerts at a park in the middle of the city. Displayed is a graph of the number of ticket sales versus the number of inches of rain that the city had each day. Is this considered a correlation, a causation, or both?

Choose one answer

Type a concept, like “slope” or “photosynthesis”.

↑ ↓ to choose · Enter to openSearch explanations and problems