Practice problem
Isotopes — Definition & Overview
By Jasper Brown

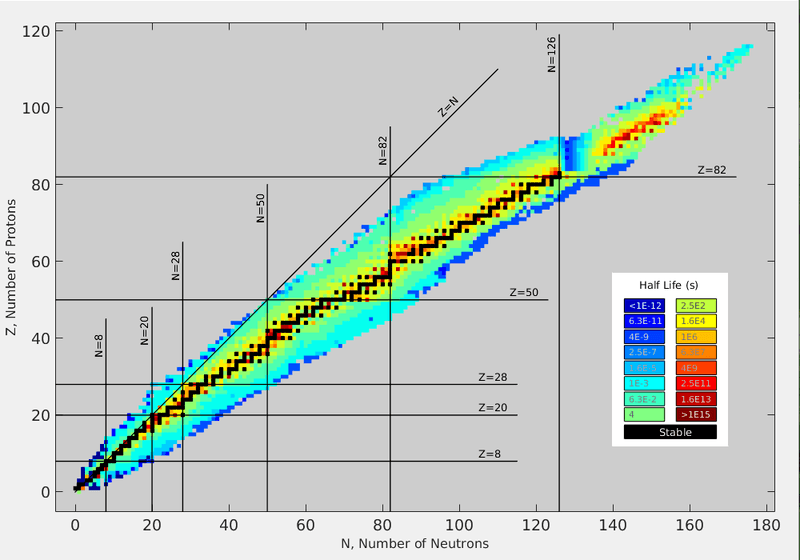
Image source: By Bdushaw CC BY 2.0, via Wikimedia Commons

Using the graph above, which isotope is most likely to be stable?
Practice problem
Image source: By Bdushaw CC BY 2.0, via Wikimedia Commons
Using the graph above, which isotope is most likely to be stable?