Practice problem
Enzymes In Biochemical Reactions — Role & Importance
By Jasper Brown

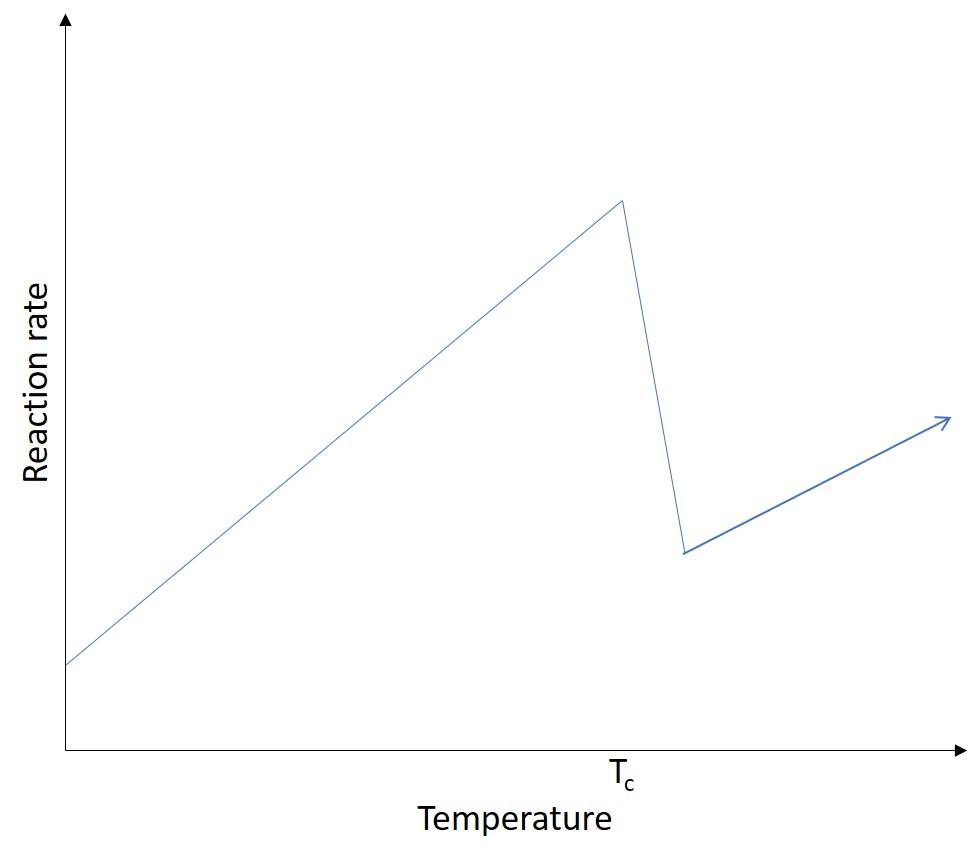
A reaction is catalyzed by an enzyme. As the temperature rises, it is observed that the reaction becomes faster and faster until some critical temperature, . At this temperature the rate of reaction plummets, but afterwards it rises again. A graphical depiction of this is shown above. What is the cause of this drop in reaction rate?