Practice problem
Write Systems of Linear Inequalities from a Graph
By Alex Federspiel

+3 contributors


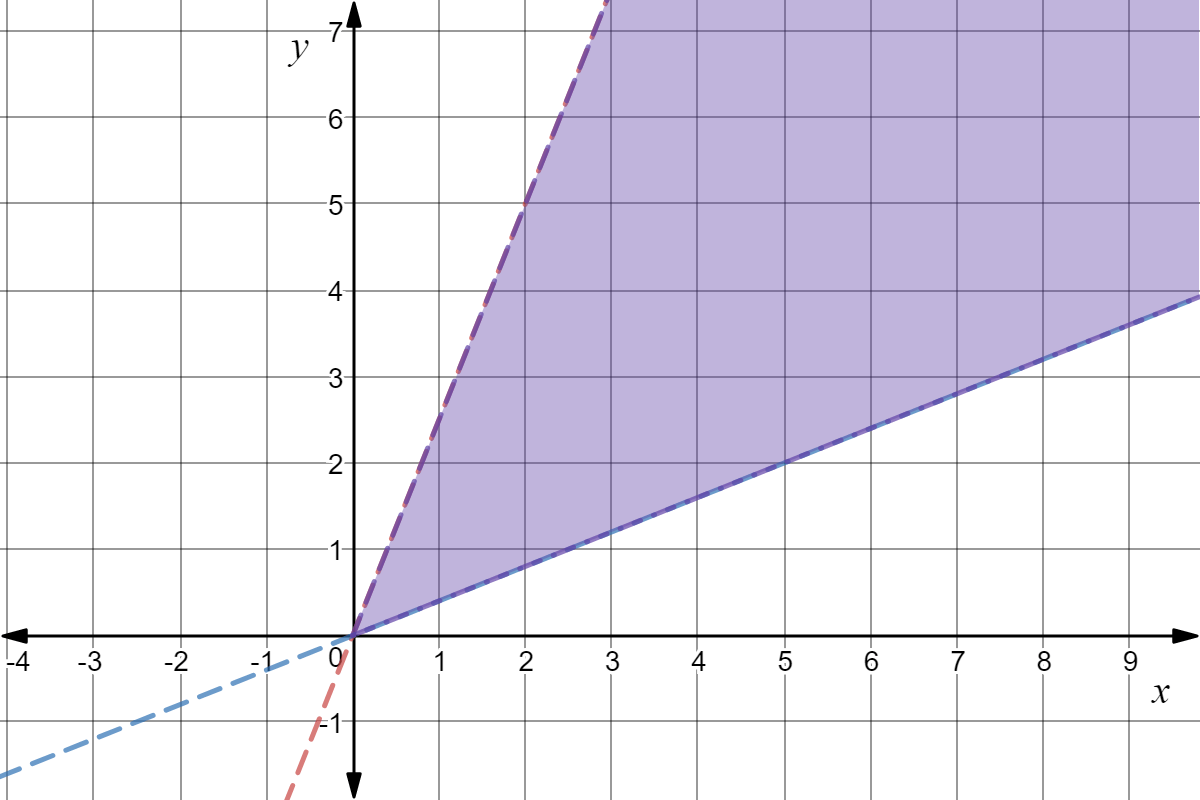
Made using Desmos
What system of linear inequalities represents this graph?
Practice problem
Made using Desmos
What system of linear inequalities represents this graph?