Practice problem
Scatter Plots: Correlation vs. Causation
+1 contributors
Contributors

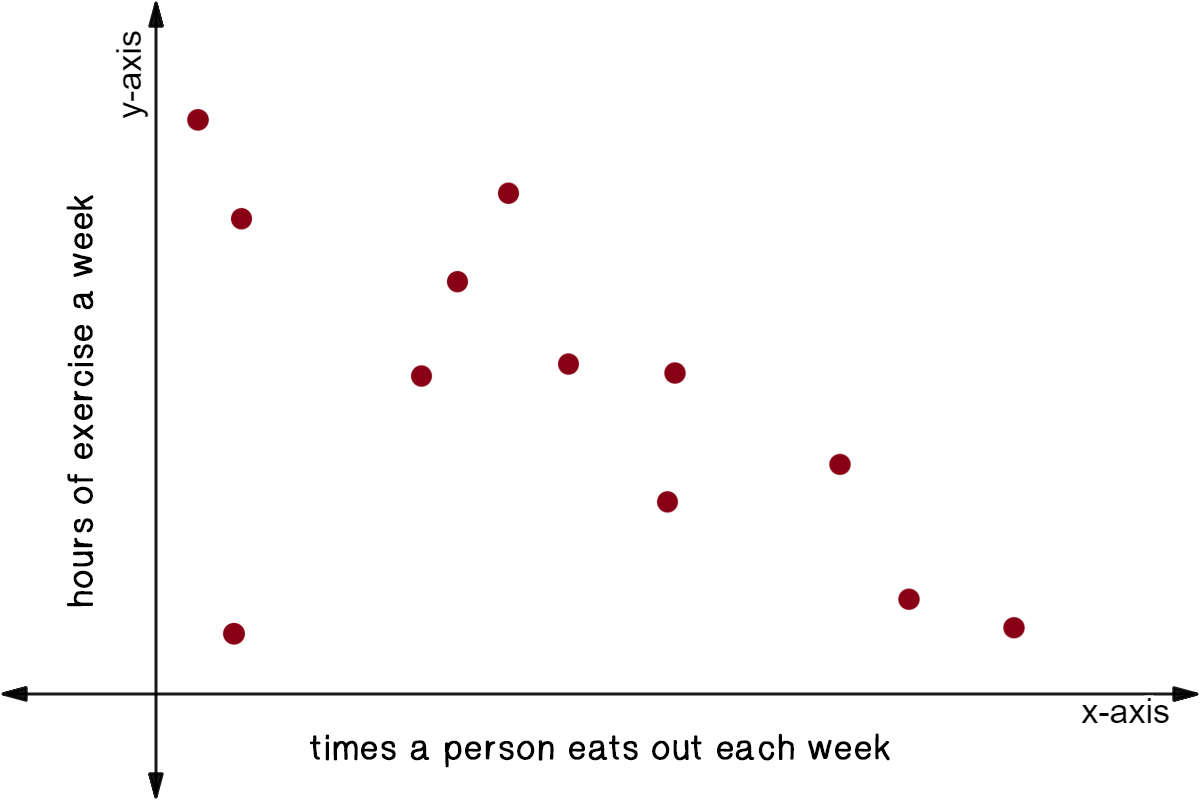
The results from a recent survey are graphed above. It can be seen that the more times a week a person goes out to eat, the less hours they exercise in a week. Is this a correlation or a causation?