Practice problem
What Is a Histogram?
+4 contributors



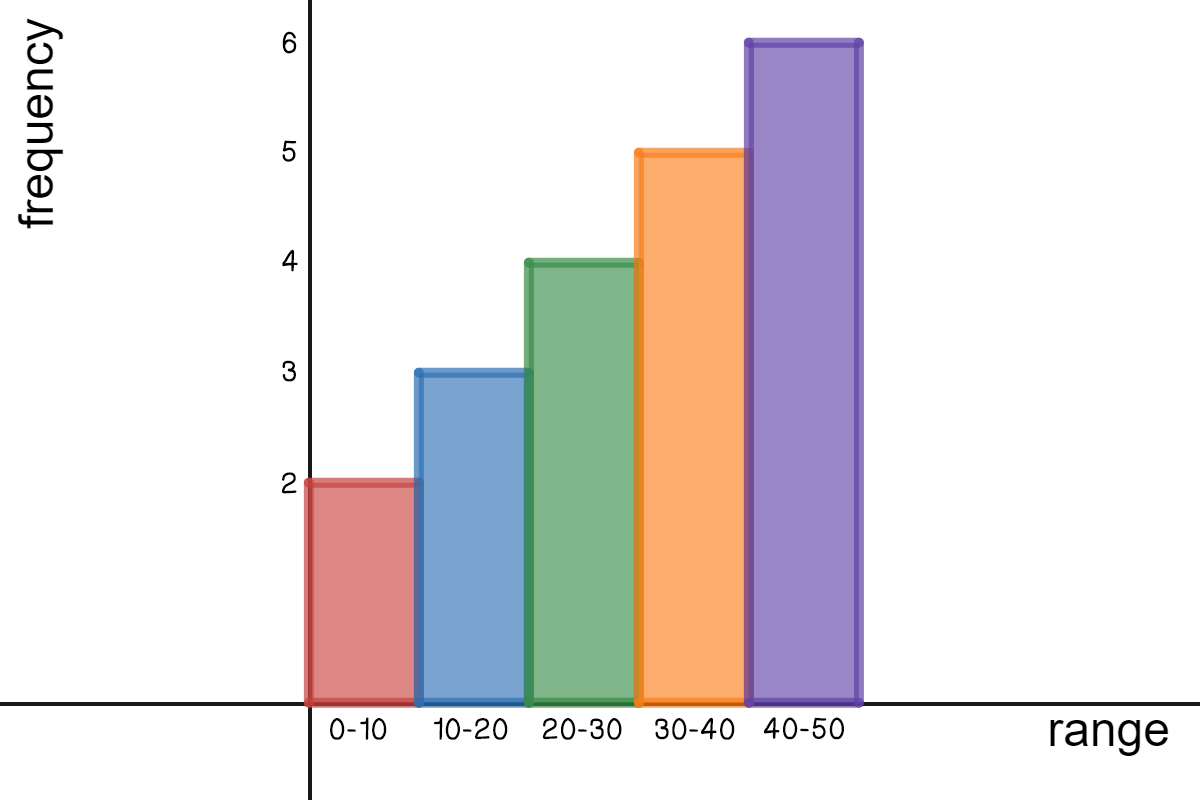
Made using Desmos
How many data points are in the set represented by the histogram above?
Practice problem
Made using Desmos
How many data points are in the set represented by the histogram above?