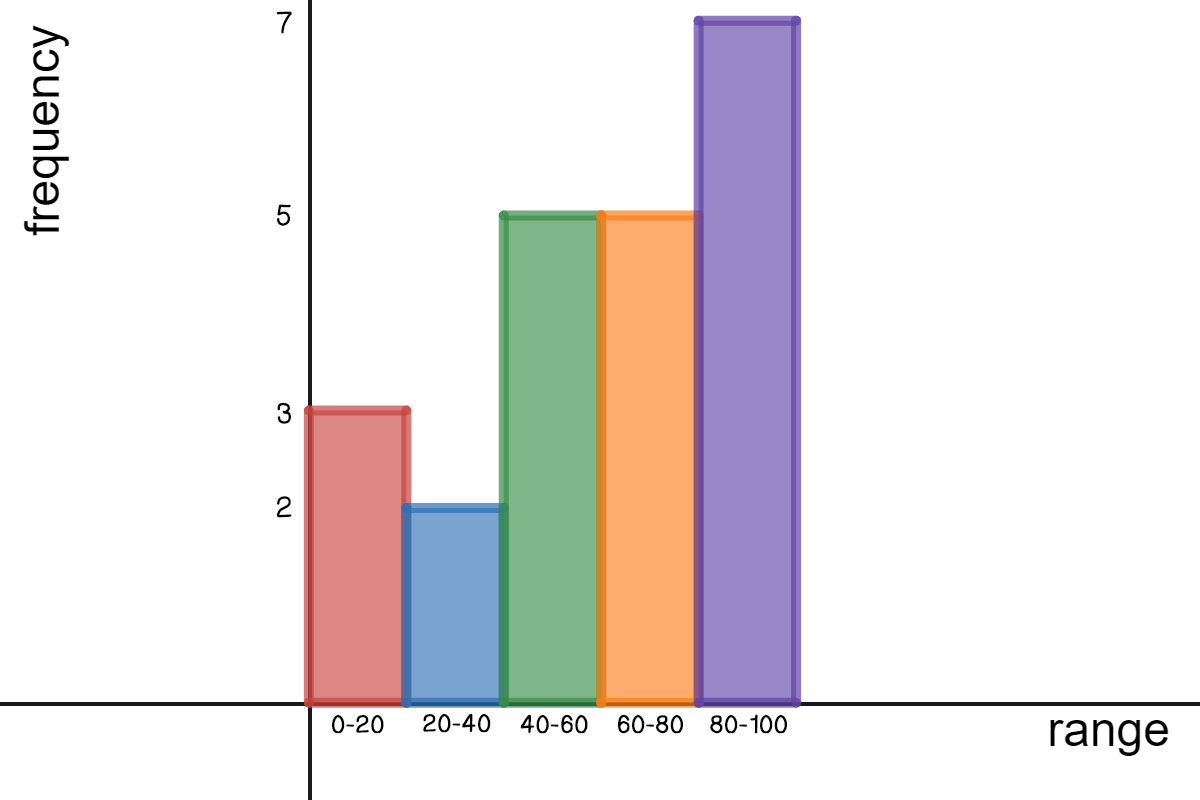
HIstogram with x-axis bin and y-axis frequency.  There are 3 values in bin 20, 2 values in bin 40, 5 values in 60, 5 values in 80, 7 values in 100

Made using Desmos

How many data points are represented by the histogram above?

Choose one answer

Type a concept, like “slope” or “photosynthesis”.

↑ ↓ to choose · Enter to openSearch explanations and problems