Practice problem
Statistical Surveys: Univariate vs. Bivariate Data
+2 contributors
Contributors


Made using Desmos
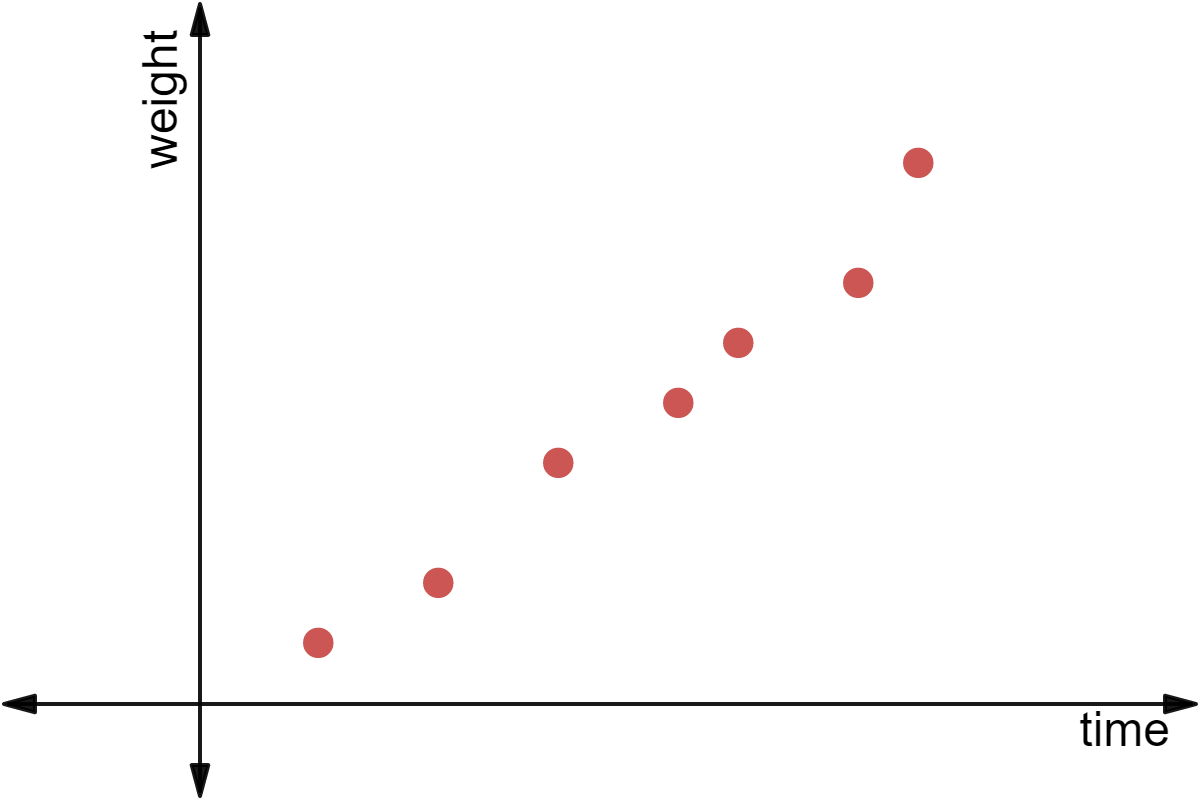
Does the graph above represent univariate or bivariate data?
Practice problem
Made using Desmos
Does the graph above represent univariate or bivariate data?