Practice problem
What Does It Mean to Be Statistically Significant?
+2 contributors
Contributors

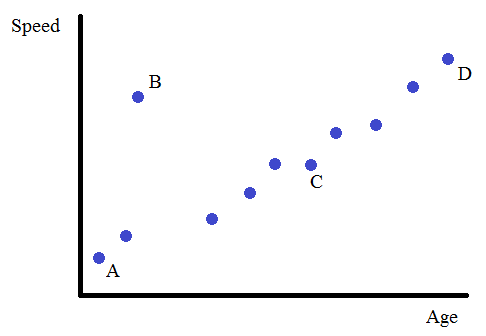
The graph above shows how fast a person solved a Rubik's Cube. Which point is not statistically significant?
Practice problem
The graph above shows how fast a person solved a Rubik's Cube. Which point is not statistically significant?