Interactive · 3 questions

Do you know how to graph linear equations?
I should also remind you that there are four types of inequalities: (greater than), (greater than or equal to), (less than or equal to), and (less than). The type of inequality we wish to graph will crucially change the graph, even if the linear portion is the same.
One last thing: we are going to be using the slope-intercept form in this explanation. When we graphed equations, they were in the format; in inequalities, the sign will be replaced with a sign representing one of the four types of inequalities.
What do you do when you receive an inequality in slope-intercept form? Here's a 3-step manual on how to graph the inequality.
Are you ready? ;-)
Step 1: Graph the line as if it were a linear equation, rather than an inequality.
Step 2: If your inequality is either or , with NO EQUAL SIGN AT THE BOTTOM, make the line dotted. Otherwise, move on to Step 3.
Step 3: If your inequality is either or , that is, some type of GREATER THAN inequality, shade above the line (in the direction of the positive y-axis. Otherwise, shade below the line (in the direction of the negative y-axis).
Step 4: Check. Plug in the coordinates of a point that is shaded in your graph. If the inequality holds, great work! Otherwise, go back to Step 1 and fix any error.
Alright, that was a mouthful. Does it help to have an example?
Example: Graph the inequality .
Step 1: Graph the line as if it were a linear equation, rather than an inequality.
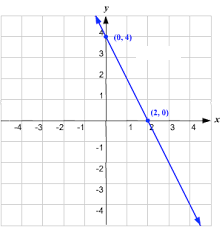
Here's Step 1!
Step 2: If your inequality is either or , with NO EQUAL SIGN AT THE BOTTOM, make the line dotted. Otherwise, move on to Step 3.
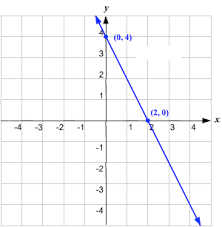
Since we have a inequality, we move on to Step 3.
Step 3: If your inequality is either or , that is, some type of GREATER THAN inequality, shade above the line (in the direction of the positive y-axis. Otherwise, shade below the line (in the direction of the negative y-axis).
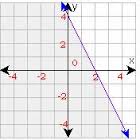
Since we have a , some type of LESS THAN inequality, we shade below the line.
Step 4: Check. Plug in the coordinates of a point that is shaded in your graph. If the inequality holds, great work! Otherwise, go back to Step 1 and fix any error.
For the sake of simplicity, let's just check the shaded point :
. This is true.
Therefore, we graphed the inequality correctly :-)
Now go do the exercises to practice your skills. Best of luck!