Calculate Standard Deviation

Before this, knowMeasures of Central Tendency: Standard Deviation

Interactive · 3 questions

Standard Deviation - What is it and how do I find it?

In these set of lessons, we're learning about the measures of central tendency. We'll learn about median, mode, mean, range, standard deviation, and statistical significance.

Standard deviation is a measure of how spread apart the numbers in a data set are. It is a single number that can help us figure out whether the numbers in the data set are clustered super close together or if there is a pretty wide range of values.

High standard deviation is represented by a wider bell curve, and low standard deviation is represented by a thinner bell curve.

Image source: By Caroline Kulczycky

Imagine that you make a histogram of your data. If you need a refresher on histograms, click here. Once you make a histogram, you can imagine a smooth curve tracing the tops of your bars, like the graphs above.

If you've got values that are all pretty close together (i.e., there's not much spread to the data), your curve will look like the one on the bottom. You can see that the curve is scrunched up (the technical term) - there is a low standard deviation. This tells us, just by looking at the graph, that there's not much variety or spread in our data.

If you've got values that are more spread out (i.e., there's more spread to the data), your curve will look like the one on the top. You can see that the curve is wider than the one on the bottom - there is a greater standard deviation.

Example

Data Set A: 2,11,15,19,43\text{Data Set A: } 2, 11, 15, 19, 43 Data Set B: 18,19,19,20,21\text{Data Set B: } 18, 19, 19, 20, 21

Of the two data sets above, which one has the largest standard deviation (σ\sigma)?

Choose one answer

Interactive · 5 questions

Standard Deviation

Before discussing how to calculate standard deviation, let's review the definition.

Definition

Standard deviation measures the dispersion the values in a data set. A low standard deviation means the values are closer to the mean. A higher standard deviation means the values are farther from the mean. Standard deviation is typically denoted with the Greek letter sigma (σ\sigma) or the letter ss.

Calculating Standard Deviation

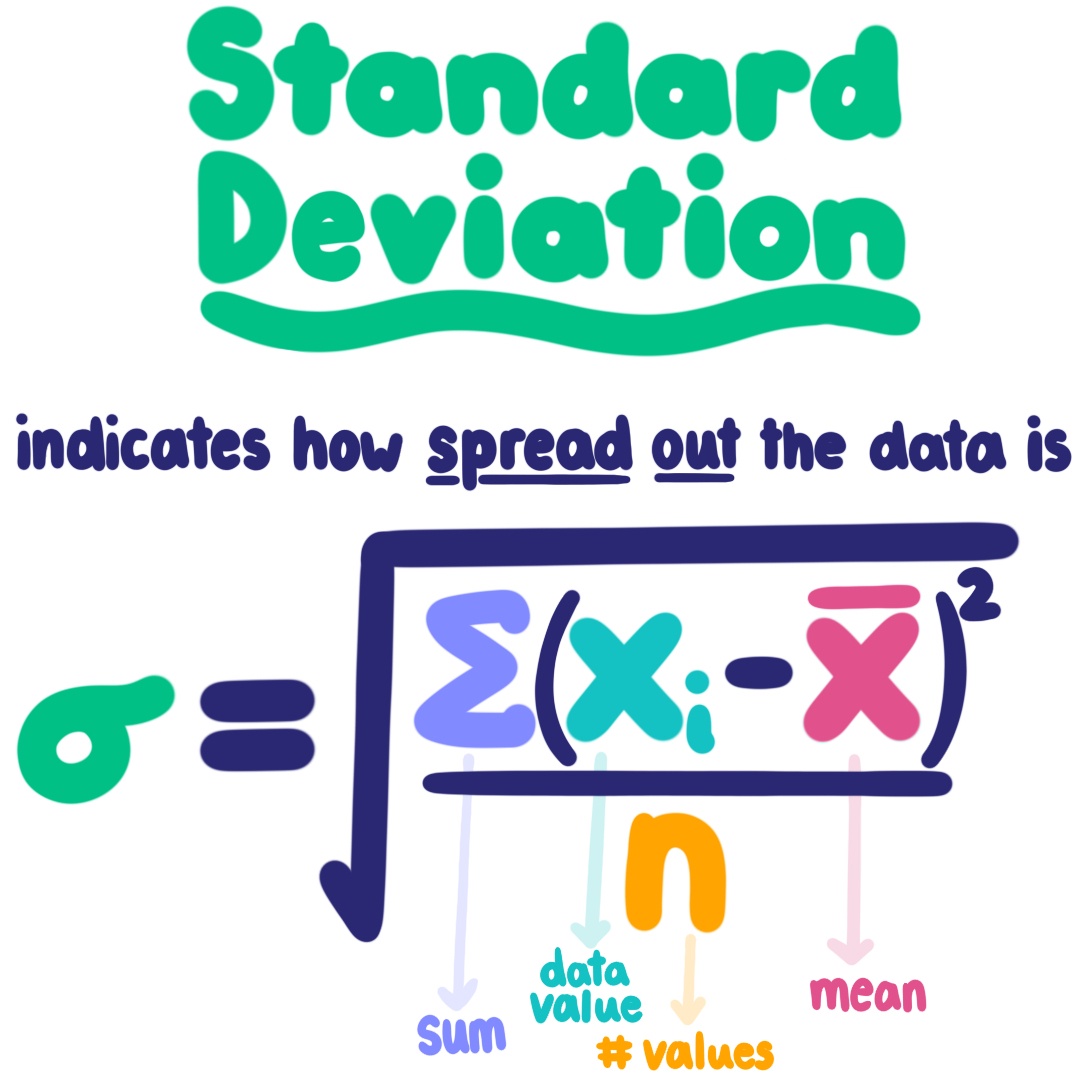
Standard deviation can be calculated by taking the square root of the variance. Now you may be wondering 'what is a variance'? Well the variance is defined as the average of the sum of the squared differences from the mean. Here's what the standard deviation looks like as a formula:

σ=∑(xi−xˉ)2N\sigma=\sqrt{\frac{\sum(x_i-\bar{x})^2}{N}}

Now what do all of these variables mean?

N=total amount of values in the data setN = \text{total amount of values in the data set}

xi=a value in the data setx_i = \text{a value in the data set}

xˉ=the mean\bar{x} = \text{the mean}

Note: ∑\sum is just math speak for "sum of"

Standard deviation indicates how spread out the data is. σ=√[Σ(x-x̄)²/n]

Image source: By Caroline Kulczycky

Let's say we have the following set of data: 12,14,22,18,16,2012,14,22,18,16,20 Let's go step by step and find the standard deviation.

Step One: Begin by finding the mean of the data:

xˉ=12+14+22+18+16+206=17\bar{x}=\frac{ 12+14+22+18+16+20}{6} = 17

Step Two: Find the difference from the mean for each value in the data set and square this difference, i.e., calculate (xi−xˉ)2(x_i-\bar{x})^2 for all values in the data set:

(12−17)2=25(14−17)2=9(22−17)2=25(18−17)2=1(16−17)2=1(20−17)2=9\begin{align} (12-17)^2&=25 \\ (14-17)^2&=9 \\ (22-17)^2&=25 \\ (18-17)^2&=1 \\ (16-17)^2&=1 \\ (20-17)^2&=9 \end{align}

Step Three: Now, find the sum of those values, i.e., calculate ∑(xi−xˉ)2:\sum(x_i-\bar{x})^2:

25+9+25+1+1+9=7025+9+25+1+1+9=70

Step Four: Divide that sum by the total amount of numbers in the data set, i.e., calculate ∑(xi−xˉ)2N:\frac{\sum(x_i-\bar{x})^2}{N}:

70÷6≈11.6770 \div 6 \approx 11.67

Step Four: Finally, take the square root of your answer to find the standard deviation of the set, i.e., calculate ∑(xi−xˉ)2N:\sqrt{\frac{\sum(x_i-\bar{x})^2}{N}}:

11.67≈3.4\sqrt{11.67}\approx 3.4

Thus, the standard deviation for the given data set is 3.43.4.

Let's try one more!

For the following set of data, what is the value of NN?

6,5,5,8,7,6,9,106,5,5,8,7,6,9,10
Choose one answer

Video · + 1 min read

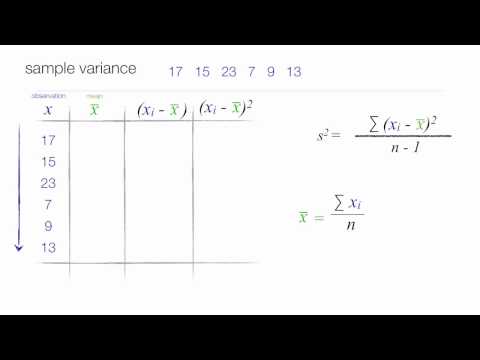
(Video) How to Calculate Standard Deviation and Variance

by statisticsfun

Let's consider the common equation for standard deviation of a sample data set (rather than a population data set):

s=1n−1∑i=1n(xi−x‾)2.s =\sqrt{ \frac{1}{n-1} \sum_{i=1}^n (x_i - \overline{x})^2}.

That looks pretty intimidating, but let's first remember what all the symbols mean. nn is the number of data points in your data set, xix_i is a point in that data set, and xˉ\bar{x} is the data's mean.

Now, in plain English, this equation is telling you to take every point in the data set (the "xix_is") and subtract the mean from them. Then square each of those results individually and add them all up. Then divide that sum by n−1n-1 and take the square root of the whole thing.

So for example, let's say that we have this data set: −1,0,1,2,3.-1, 0, 1, 2, 3. The mean here is −1+0+1+2+35=55=1.\frac{-1+0+1+2+3}{5} = \frac{5}{5}=1.

So when we do the standard deviation, we subtract the mean from every number, thus we get: −1−1=−2,0−1=−1,1−1=0,2−1=1,3−1=2.-1-1=-2, 0-1=-1, 1-1=0, 2-1=1, 3-1=2.

Now we square all those numbers and add them together. (−2)2=4,(−1)2=1,(0)2=0,(1)2=1,(2)2=4(-2)^2=4, (-1)^2=1, (0)^2=0, (1)^2=1, (2)^2=4 4+1+0+1+4=104+1+0+1+4=10

Then, divide all of that by n−1=5−1=4n-1=5-1=4 to get 10/4=2.5.10/4=2.5.

Finally, take the square root, and we see that the standard deviation is about 1.58.1.58.

Type a concept, like “slope” or “photosynthesis”.

↑ ↓ to choose · Enter to openSearch explanations and problems