Concave Up and Down Functions, and Inflection Points

Read · 1 min

The concavity of a function/graph is an important property pertaining to the second derivative of the function. In particular:

If f′′(x)>0f''(x) > 0, the graph is concave up (or convex) at that value of xx.

If f′′(x)<0f''(x) < 0, the graph is concave down (or just concave) at that value of xx.

If f′′(x)=0f''(x) = 0 and the concavity of the graph changes (from up to down or vice versa), then the graph is at an inflection point.

Determining concavity obviously requires finding the second derivative, if it even exists.

Example: The graph of exe^x is always concave up because the second derivative of exe^x is exe^x, which is positive for all real numbers.

Example: f(x)=x5−x4f(x) = x^5 - x^4 can have its concavity analyzed. Find the first two derivatives:

f′(x)=5x4−4x3⇒f'(x) = 5x^4 - 4x^3 \Rightarrow

f′′(x)=20x3−12x2f''(x) = 20x^3 - 12x^2

We must first find the roots, the inflection points:

f′′(x)=0=20x3−12x2⇒f''(x) = 0 = 20x^3 - 12x^2 \Rightarrow 5x3−3x2=0⇒5x^3 - 3x^2 = 0 \Rightarrow x2(5x−3)=0x^2(5x - 3) = 0

The roots and thus the inflection points are x=0x = 0 and x=35x = \frac{3}{5}. For any value greater than 35\frac{3}{5}, the value of f′′(x)>0f''(x) > 0 and thus the graph is convex. For all other values besides the inflection points f′′(x)<0f''(x) < 0 and thus the graph is concave. In general check one value of xx between each inflection point; the concavity will not change without an inflection point in between, assuming that the function f′′(x)f''(x) is continuous.

Video · + 2 min read

(Video) Concavity, Inflection Points, and Second Derivatives

by PatrickJMT

Here's a video by patrickJMT showing you how the second derivative test can tell us the concavity of a function.

A function is concave up (or convex) if it bends upwards. A function is concave down (or just concave) if it bends downwards.

A concave down function bends downwards; a concave up function bends upwards

I personally would always mix these two up. If you think you might too, try to come up with a way to connect these concepts easily. I made concave down blue because you're down if you're feeling blue. Concave up is red because the sun is red (kinda) and is above.

So let's look at an example to see how this all works. f(x)=2+3x2−x3f(x)=2+3x^2-x^3

To begin, we need to find the second derivative. f(x)=2+3x2−x3f′(x)=6x−3x2f′′(x)=6−6x\begin{align} f(x)&=2+3x^2-x^3\\ f'(x)&=6x-3x^2\\ f''(x)&=6-6x \end{align}

Just like with the first derivative test, we need to find the points where the second derivative is equal to zero or undefined. \begin{align} 6-6x&=0\ 6x&=6\ x&=1 \end{align}

Now we make a sign chart like we did to find where the function increased and decreased.

An empty sign chart

Just like before, we need to take a number within each interval and plug it into the second derivative to find out if it returns a positive or negative value. Let's use x=0x=0 and x=2x=2. f′′(0)=6−6(0)=6f′′(2)=6−6(2)=−12\begin{align} f''(0)&=6-6\color{red}{(0)}\\ &=6\\ f''(2)&=6-6\color{red}{(2)}\\ &=-12 \end{align}

A sign chart with a + to the left of 1 and a - to the right of 1

If the interval is positive then this tells us the interval is concave up. Similarly, if the interval is negative then this tells us the interval is concave down.

So in our example, our function is concave up on the interval (−∞,1)(-\infty,1) and our function is concave down on the interval (1,∞)(1,\infty).

A function that bends upwards when x < 1 and downwards when x > 1

The next example he looks at is: f(x)=(x2−1)3f(x)=(x^2-1)^3

Again, we begin by finding the second derivative. \begin{align} f(x)&=(x^2-1)^3\ f'(x)&=3(x^2-1)^2\cdot\color{red}{[x^2-1]'}\ &=6x(x^2-1)^2\ f''(x)&=\color{red}{[6x]'}(x^2-1)^2+6x\color{red}{[(x^2-1)^2]'}\ &=6(x^2-1)^2+6x\cdot2(x^2-1)\cdot\color{red}{[x^2-1]'}\ &=6(x^2-1)^2+6x\cdot2(x^2-1)\cdot2x\ &=6(x^2-1)^2+24x^2(x^2-1)\ &=6(x^2-1)[(x^2-1)+4x^2]\ &=6(x^2-1)[x^2-1+4x^2]\ &=6(x^2-1)(5x^2-1) \end{align}

Next, let's find where this equals zero. 6(x2−1)(5x2−1)=0x2−1=0 or 5x2−1=0x2=1 or 5x2=1x=±1 or x=±156(x^2-1)(5x^2-1)=0\\ \begin{alignat}{3} &x^2-1=0\quad&&\text{ or }\quad&&5x^2-1=0\\ &x^2=1\quad&&\text{ or }\quad&&5x^2=1\\ &x=\pm1\quad&&\text{ or }\quad&&x=\pm\frac1{\sqrt5} \end{alignat}

Now, we make our sign chart.

An empty sign chart with the zeros of f''(x)

Take a number within each of these five intervals and plug it into the second derivative to see if the result is negative or positive.

I'm not gonna do these out, but here's what you should get.

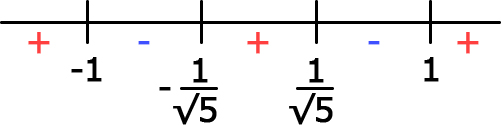
A sign chart with the pattern +, -, +, -, + in between the zeros of f''(x)

So we have that our function is concave up on the intervals (−∞,−1),(-\infty,-1), (−15,15),\left(-\frac{1}{\sqrt5},\frac{1}{\sqrt5}\right), and (1,∞)(1,\infty).

Our function is also concave down on the intervals (−1,−15)\left(-1,-\frac{1}{\sqrt5}\right) and (15,1)\left(\frac{1}{\sqrt5},1\right).

If we plot this graph we can see that this gave us the right answer.

A function can be concave up or concave down on many different intervals of its domain

Type a concept, like “slope” or “photosynthesis”.

↑ ↓ to choose · Enter to openSearch explanations and problems