Interactive · 3 questions

+2 contributors



Earlier in this statistics unit, we learned about frequency tables and frequency distributions. The next lesson will cover two-way frequency tables. Let's look at another type.
Cumulative frequency is just the total frequency at a given interval.
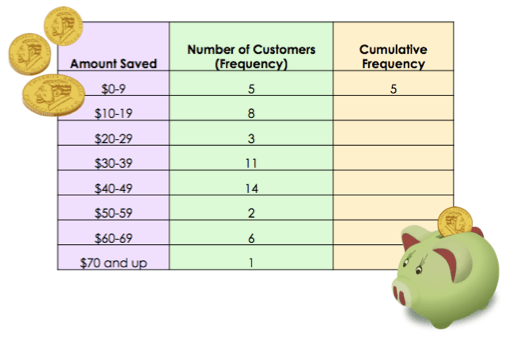
For example, suppose we have the following frequency table:
You might remember that the highest frequency represents the mode and the middle value is the median.
To make a cumulative frequency table, we add a column on to the end.
The cumulative frequency of bin is going to be the total frequency up to that point. Since it's the first bin, the cumulative frequency will be the same as the frequency. The cumulative frequency in the first interval will always be the same as its frequency.
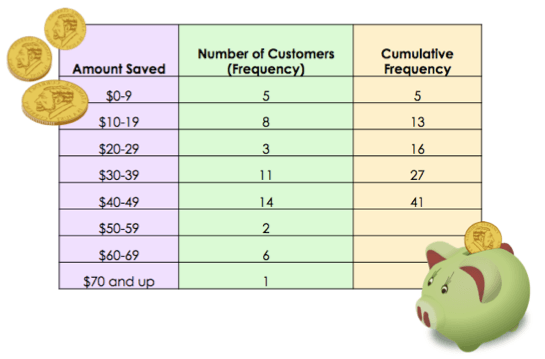
Next, we want to find the cumulative frequency of bin . This is the total frequency of everything up to this point. In other words, the frequency sum of bins and . .
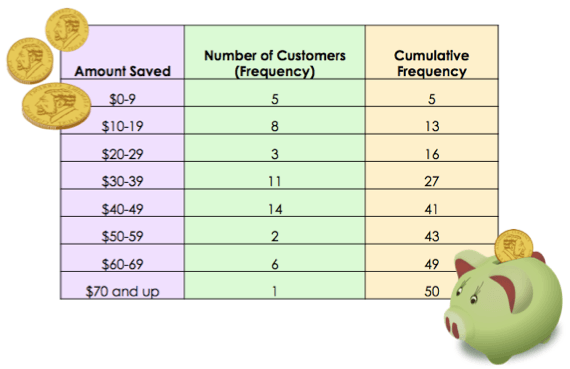
Bin will be the frequency sum of bins , , and . Likewise, bin will be the frequency sum of bins , , , and . The cumulative frequency of the last interval will always be the total frequency.
Marcus made a frequency table for the grades each kid in his math class received on the test. How many got at least a ?
Using Cumulative Frequency to Find Frequency
We can also work backwards and find a bin's frequency, given its cumulative frequency. Suppose we have the following table: To find the frequency of a given bin, subtract the previous cumulative frequency from the current cumulative frequency.
Because the first bin's frequency is the same as its cumulative frequency, we know 's frequency is .
To find 's frequency we subtract 's cumulative frequency from 's. Doing this for the other bins, our table becomes:
Given the following cumulative frequency table, which bin has the largest frequency?
Finding the Cumulative Frequency for a Certain Range
Sometimes, you'll want to find the cumulative frequency not starting at the beginning. For example, you might want the cumulative frequency of the last three bins.
Suppose on the next math test, Marcus's students get the following grades. (Ignore the fact that there are more kids in the class, now.)
He now wants to know how many kids received at most a . This is the same as asking for the cumulative frequency of just and . But, we don't know this, since each of their cumulative frequencies are including the frequencies of and .
To find this, we subtract the last cumulative frequency of the bins we don't need from the last cumulative frequency of the bins we do want. In this problem, we don't care about bins and . Bin is the last for these. We do care about bins and . Bin is the last for these. Thus, we get:
The cumulative frequency of and is . So students received at most a on Marcus's test.
Rebecca records the heights of her office. She makes the following cumulative frequency table. How many coworkers have a height greater than 5.6 and less than 6?