Interactive · 5 questions
+5 contributors




What is a discrete graph?
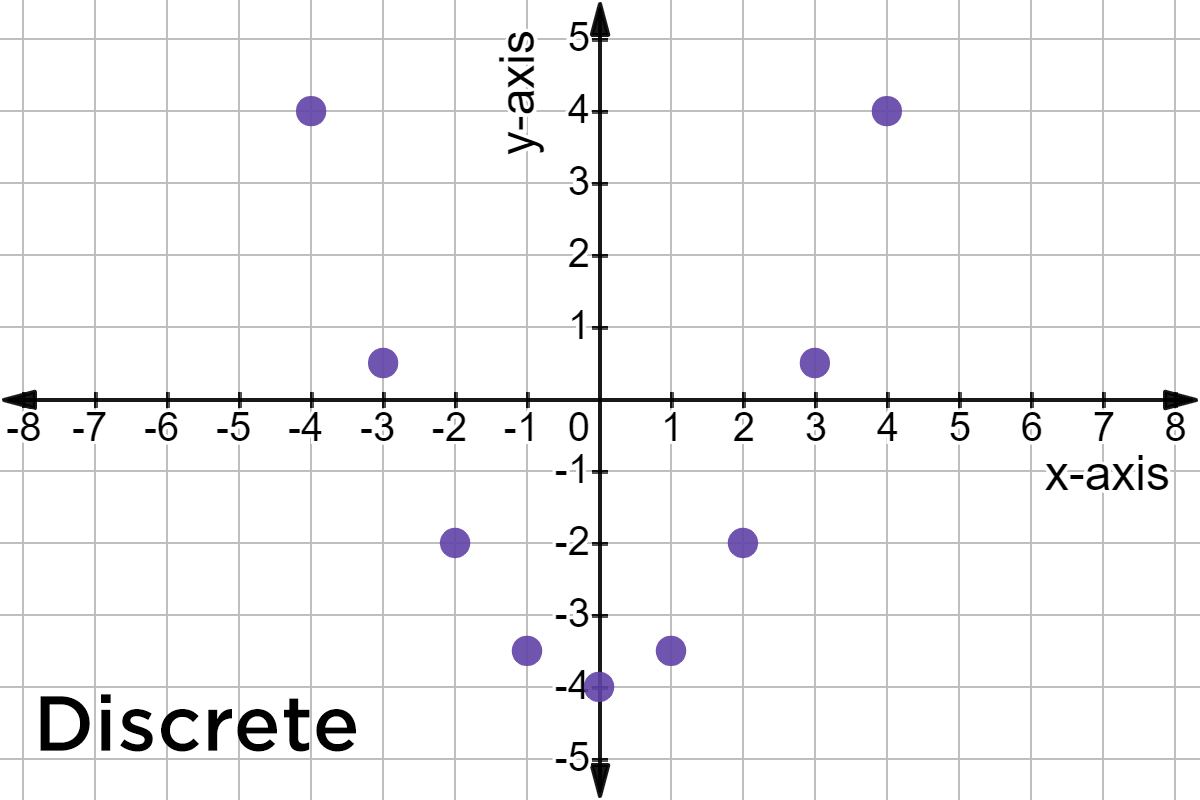
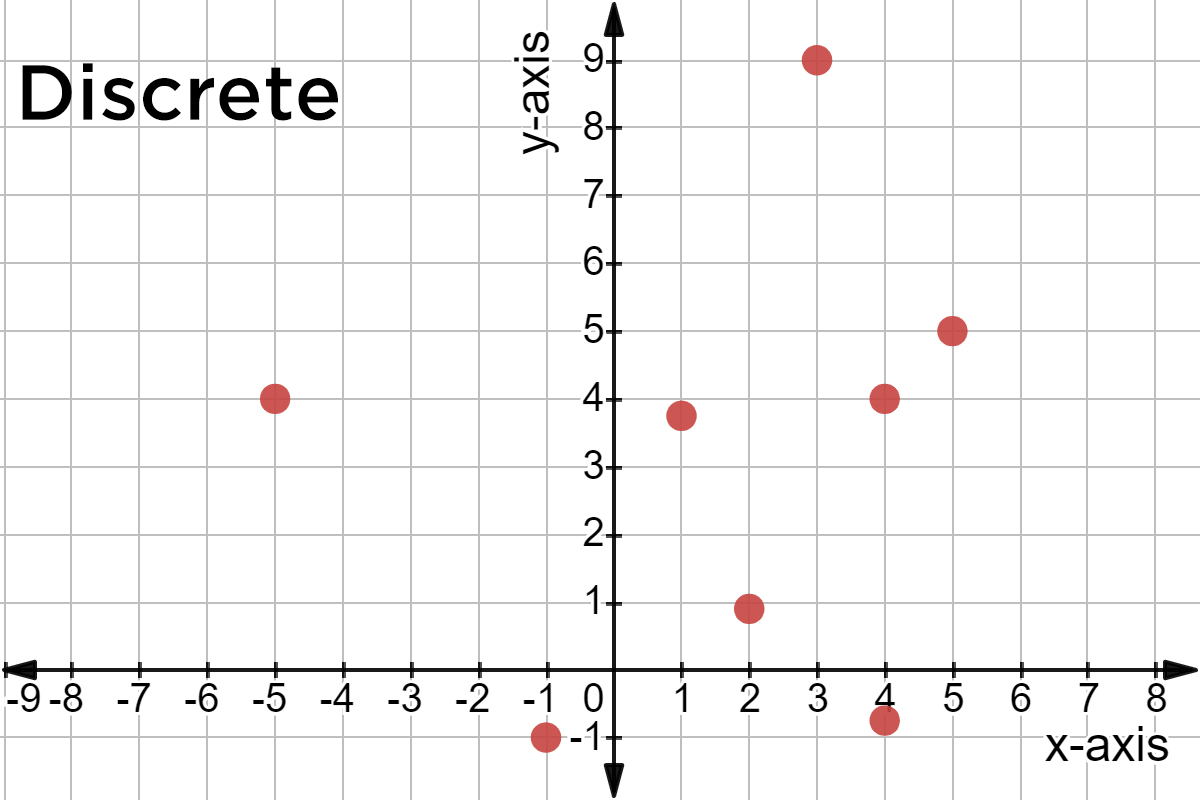
The domain and range of a discrete function are discrete sets of values (points), rather than an interval. It's actually easier to think about discrete graphs, which are the graphs of discrete functions.
Discrete graphs don't have continuous lines. Instead, discrete graphs look like plotted points.
To reduce it even further:
- Discrete graphs: dots
- Continuous graphs: smooth lines
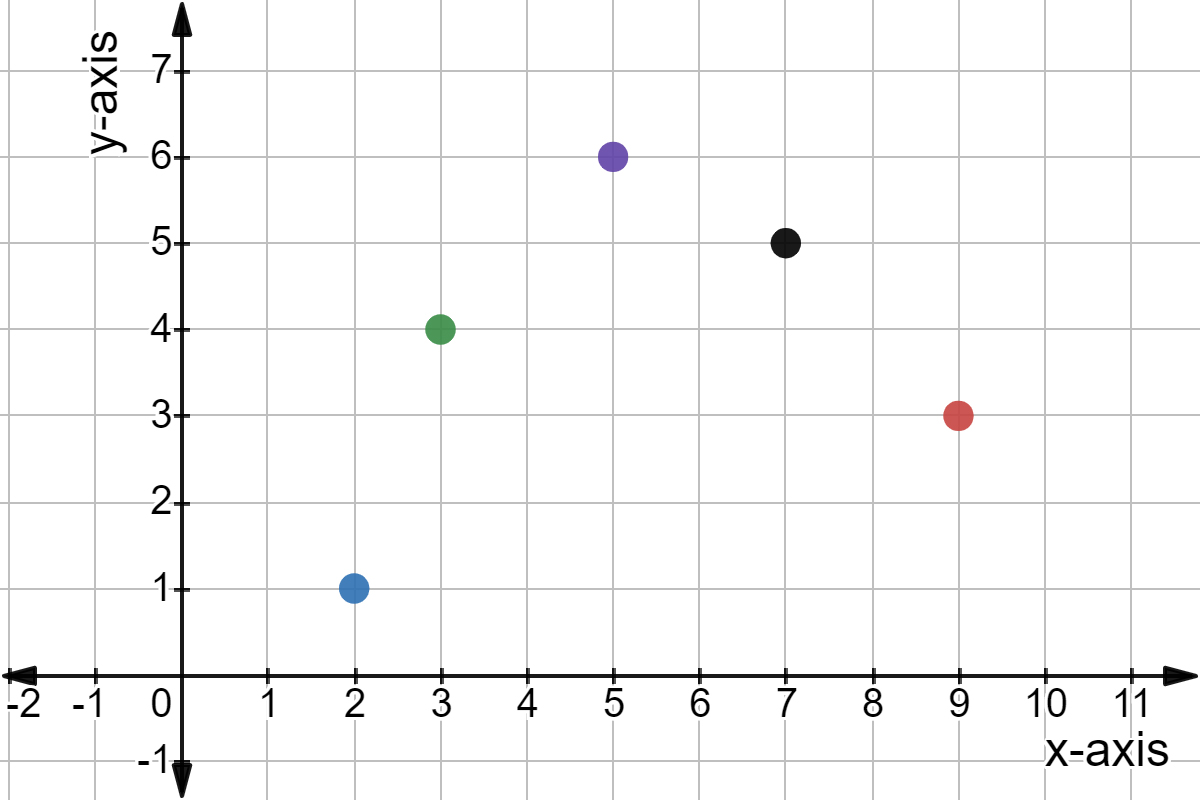
This is an example of a discrete graph. It only includes discrete points, not continuous lines.
Made using Desmos
Most of the time, discrete functions involve data that are counted.
Things like number of people visiting a store, dollars in a bank account, or number of hours worked—stuff that has a limit to the level of accuracy we can use to measure it—are all examples of discrete data.
Continuous functions involve data can be infinitely broken down. These functions can be linear or nonlinear.
Things like height, weight, and other measurements are all examples of continuous data.
Being able to distinguish between discrete functions and continuous functions will help with graphing the functions.
Check off all examples of discrete data from the list below.
Number of pets in a household, number of days spent traveling, and amount of money spent on birthday gifts are all examples of things that generate discrete data. You can't have half a pet in a household or it gets really weird and you have to question your definition of a "pet"; if you count any day when you did any traveling, you'll always get a whole number of days; and while you can get as specific as cents (fractions of a dollar) when talking about money, you can't go down to fractions of a cent. This means that all of these numbers can only get so specific, and there'll be gaps between them where we can't ever have any data.
On the other hand, age can be measured down to fractions of a second, and weight can get as specific as grams, micrograms, or even fractions of micrograms, so anything measuring exact age and weight will generate continuous data. These are continuous variables.
Made using Desmos
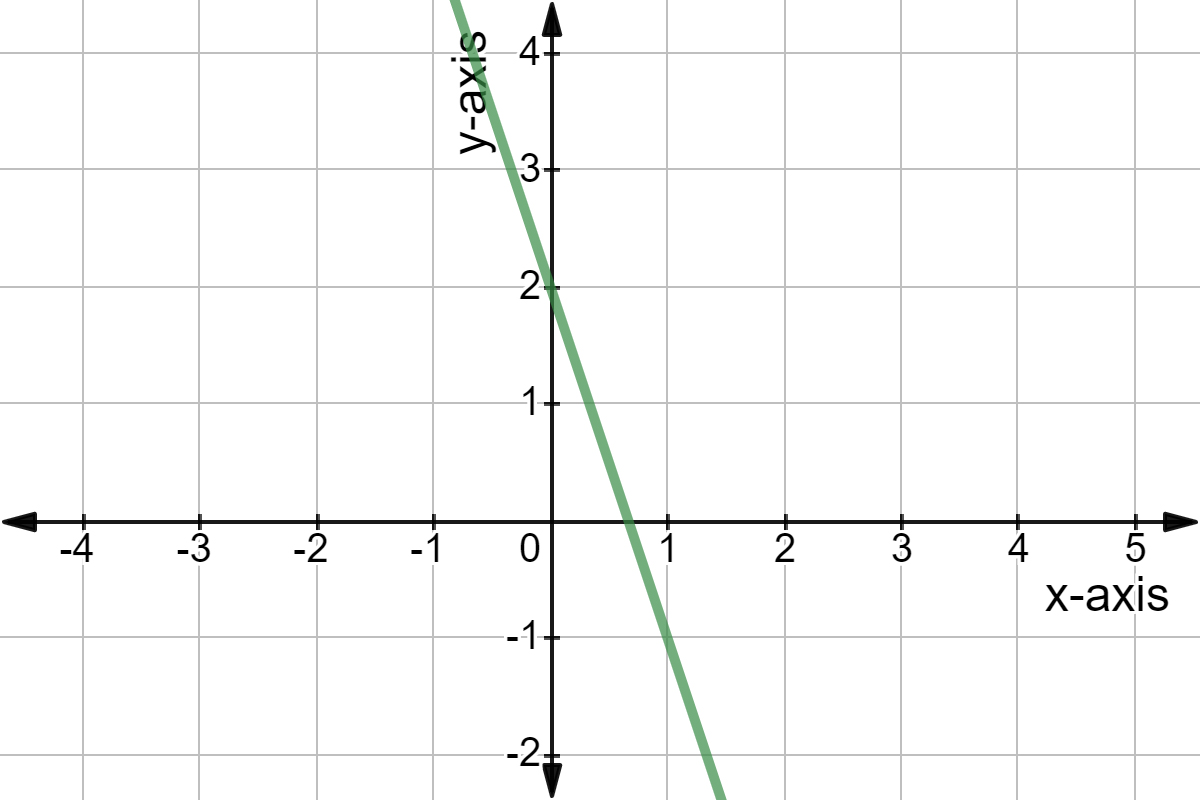
Is the graph above a discrete graph?
The graph above is just one smooth line with no gaps or holes, so it's actually a continuous graph. We don't see the characteristic dots of a discrete function's graph!
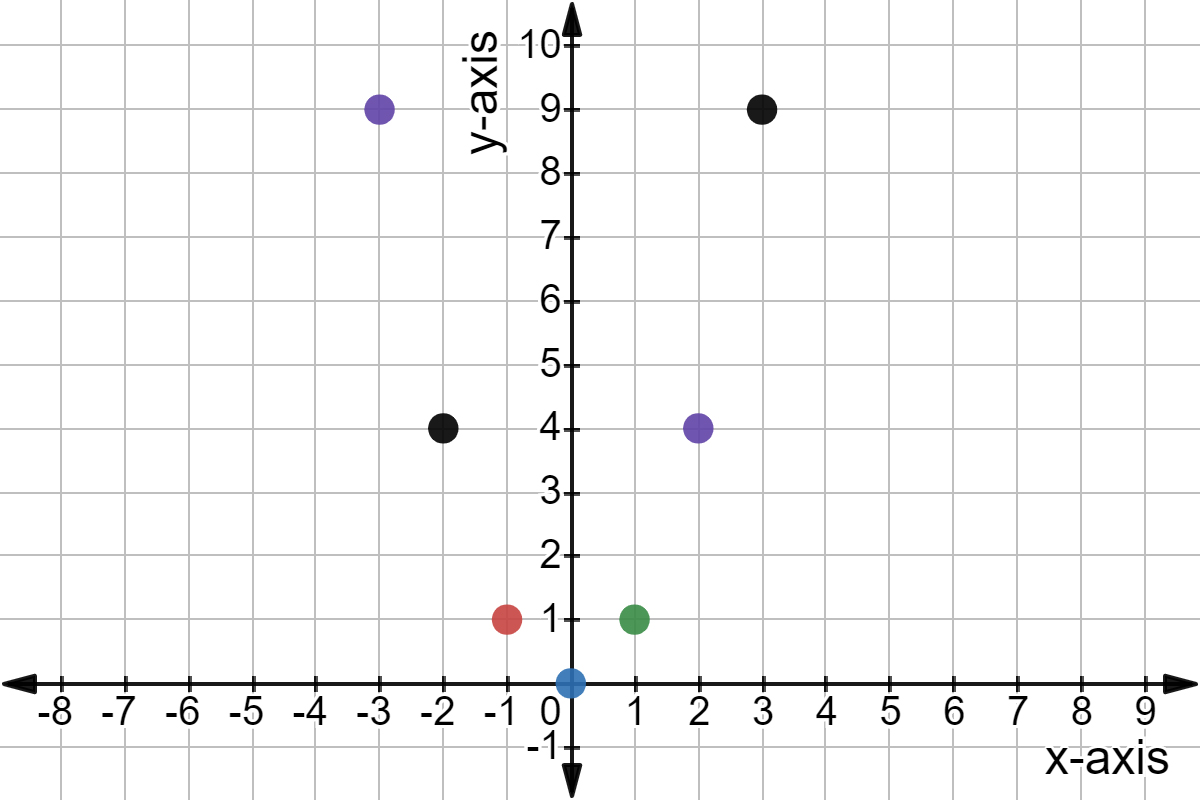
Made using Desmos
Is the graph above a discrete graph?
This graph is a collection of points, so even though those points form a recognizable shape it is considered discrete. The above graph looks kind of like a quadratic function!
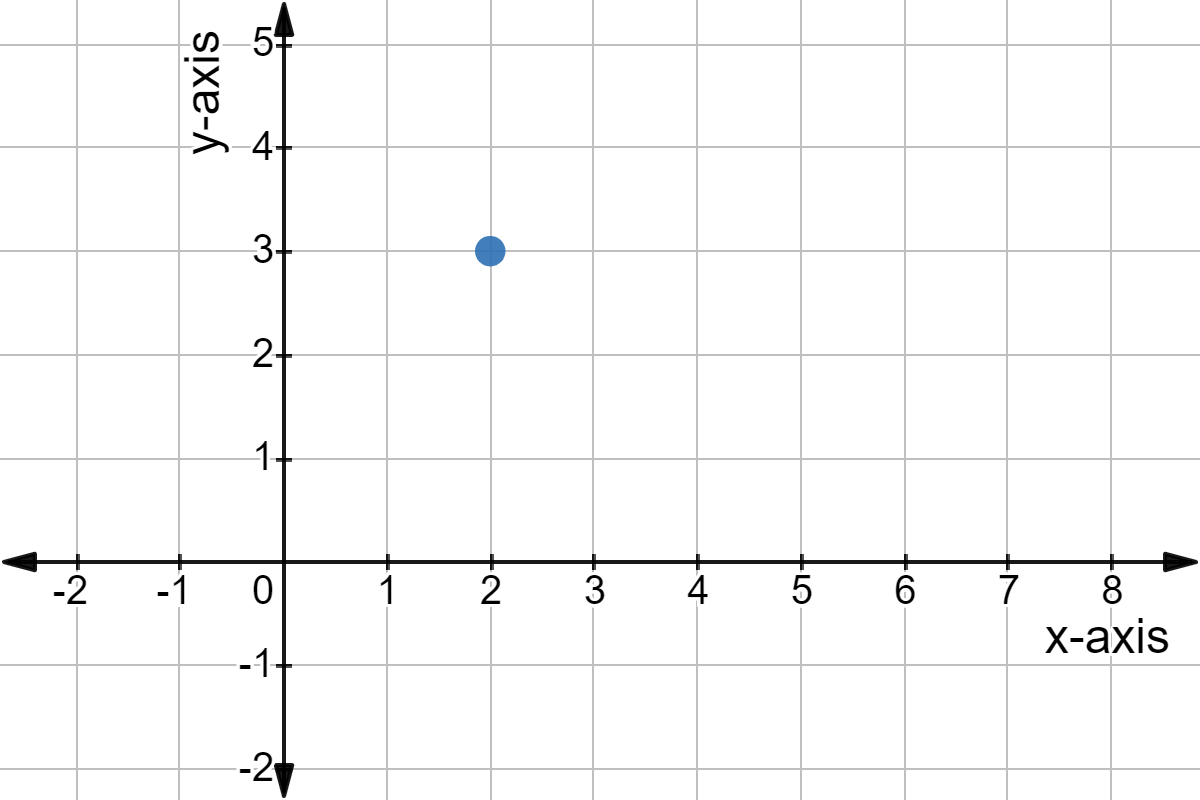
Made using Desmos
Is the graph above a discrete graph?
This graph is only one point, so you might not think of it as a collection. However, in math, sometimes a group that only holds one point still counts as a group, so this graph is considered to be discrete!
Another thing we can do is look at the coordinates of discrete data. This comes down to reading the axes: the -axis is the first coordinate, and the -axis is the second coordinate. Let's look at an example:
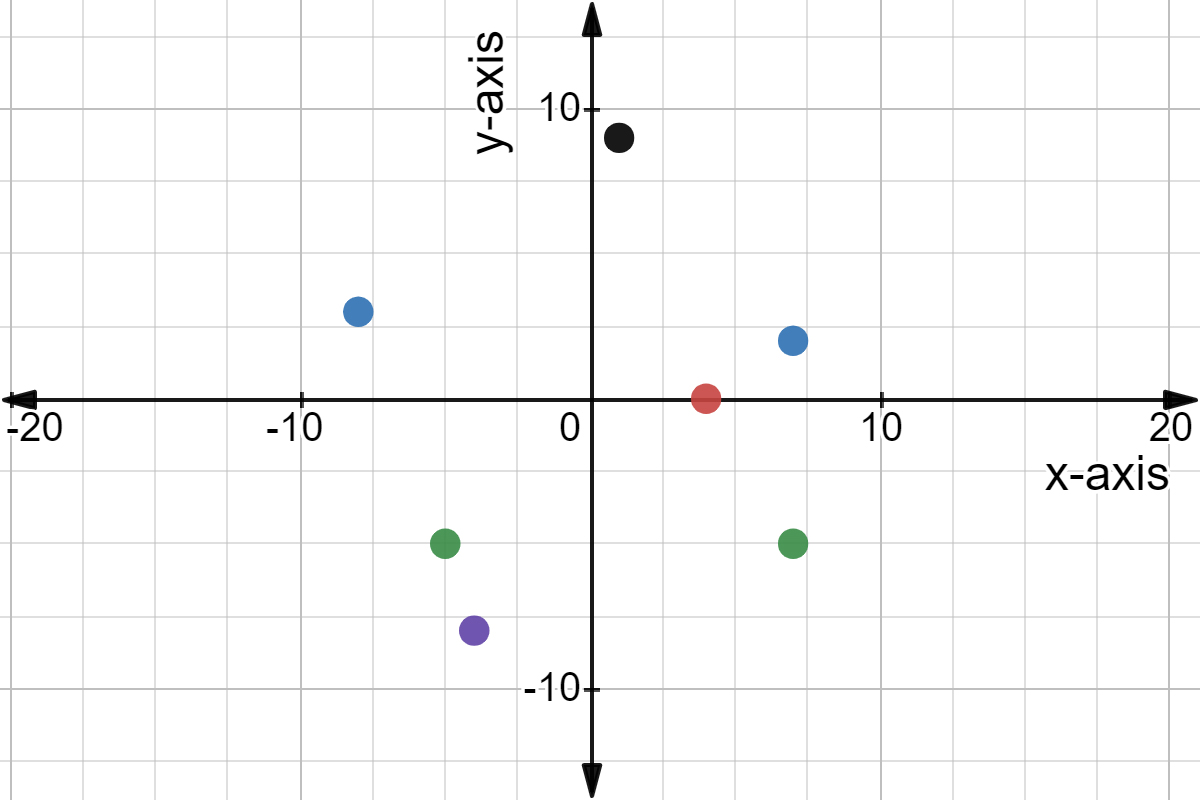
Made using Desmos
Which of the following are points in the discrete data set with an -coordinate equal to
Start at the origin, move four units to the left, and then scan the vertical line and include any points that are on it. In this case, is the only one, but there could be a bunch depending on the data set.