
Interactive · 2 questions

+2 contributors


Domain, Range, and Interval Notation
Generally speaking, the domain of a function is all possible inputs, and the range of a function is all possible outputs. Consider the following two sets: The domain would be the integers through . The range would be the integers through .
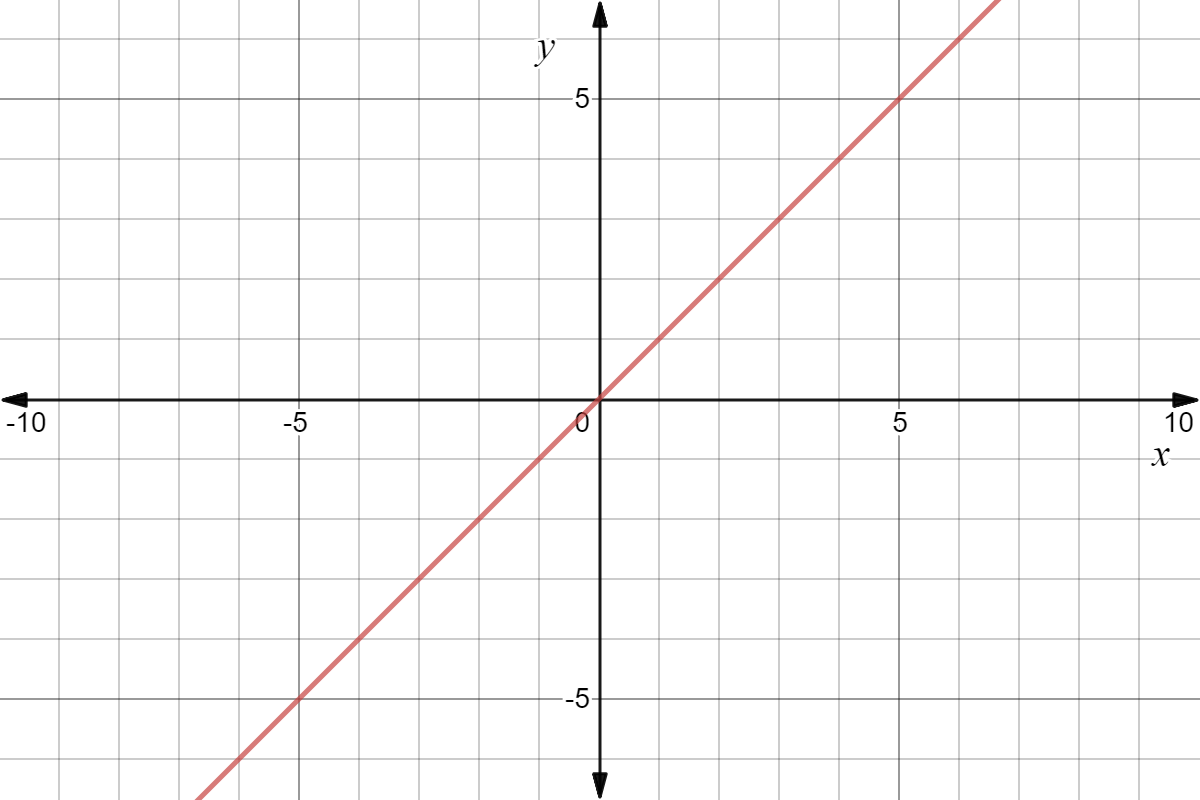
We can find the domain and range of a function by looking at its graph. In a regular graph, the domain is all of the possible values, while the range is all of the possible values. Let's start by looking at the graph of .
Made with Desmos
This graph expands infinitely in both directions and on both axes. This means that both the domain and range include all real numbers. All linear functions that don't specify a stopping point will have a domain and range of all real numbers.
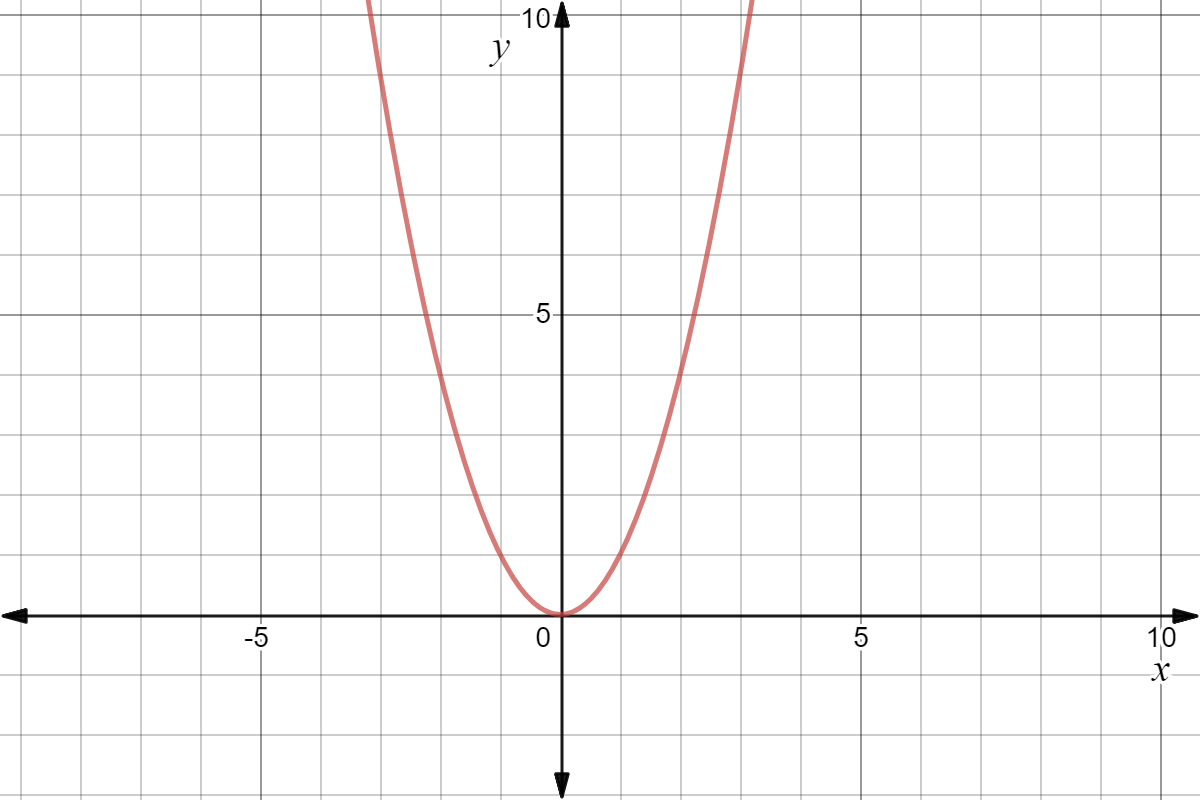
Let's look at a function that has a more defined range, .
Made with Desmos
The domain of this graph is still all numbers as any value can be put into the function, but there is a minimum value of . This means that the range is .
Some functions have restrictions on both the domain and range, such as . This is the square root graph or a square root function.

Made with Desmos
This graph has no values less than , as well as no values less than . Let's determine the domain. This means that both the domain and range include all numbers from to . Our domain is a set of numbers greater than and equal to zero.
We're going to try a practice problem to see how we're doing.

Graph of
Made with Desmos
What is the domain and range of the graph of above? Check all that are correct.
The domain of the graph is all real numbers as any value can be put into our function. The range of the graph is because all possible outputs will fall in between those two numbers.
Interval Notation
All of our domain and range intervals can be written with interval notation. When using interval notation it is important to remember that parentheses denote exclusive intervals, or intervals that don't include the outermost numbers, and brackets denote intervals that are inclusive and do include the outer numbers. Here is an overview of each of the different intervals.
We can write our domain and range from the examples above in interval notation. The domain is and the range is
For the function , our domain and range were both all real numbers. This can be written as . Any time one of your bounds is , the interval is exclusive as there is no real end to the interval.
Try this one for yourself:
What is the domain and range of a function defined as in interval notation?
The correct interval notation for both the domain and range is .
Wrap Up
- All functions have a domain and range
- Domain is the entire set of inputs, on a graph this is normally all values
- Range is the entire set of outputs, on a graph this is normally all values
- Different types of functions have restrictions on their domain and range which can be seen through their graphs
- Interval notation is used to quickly show the domain and range of a function


