Read · 1 min

Central Moment of a Random Variable
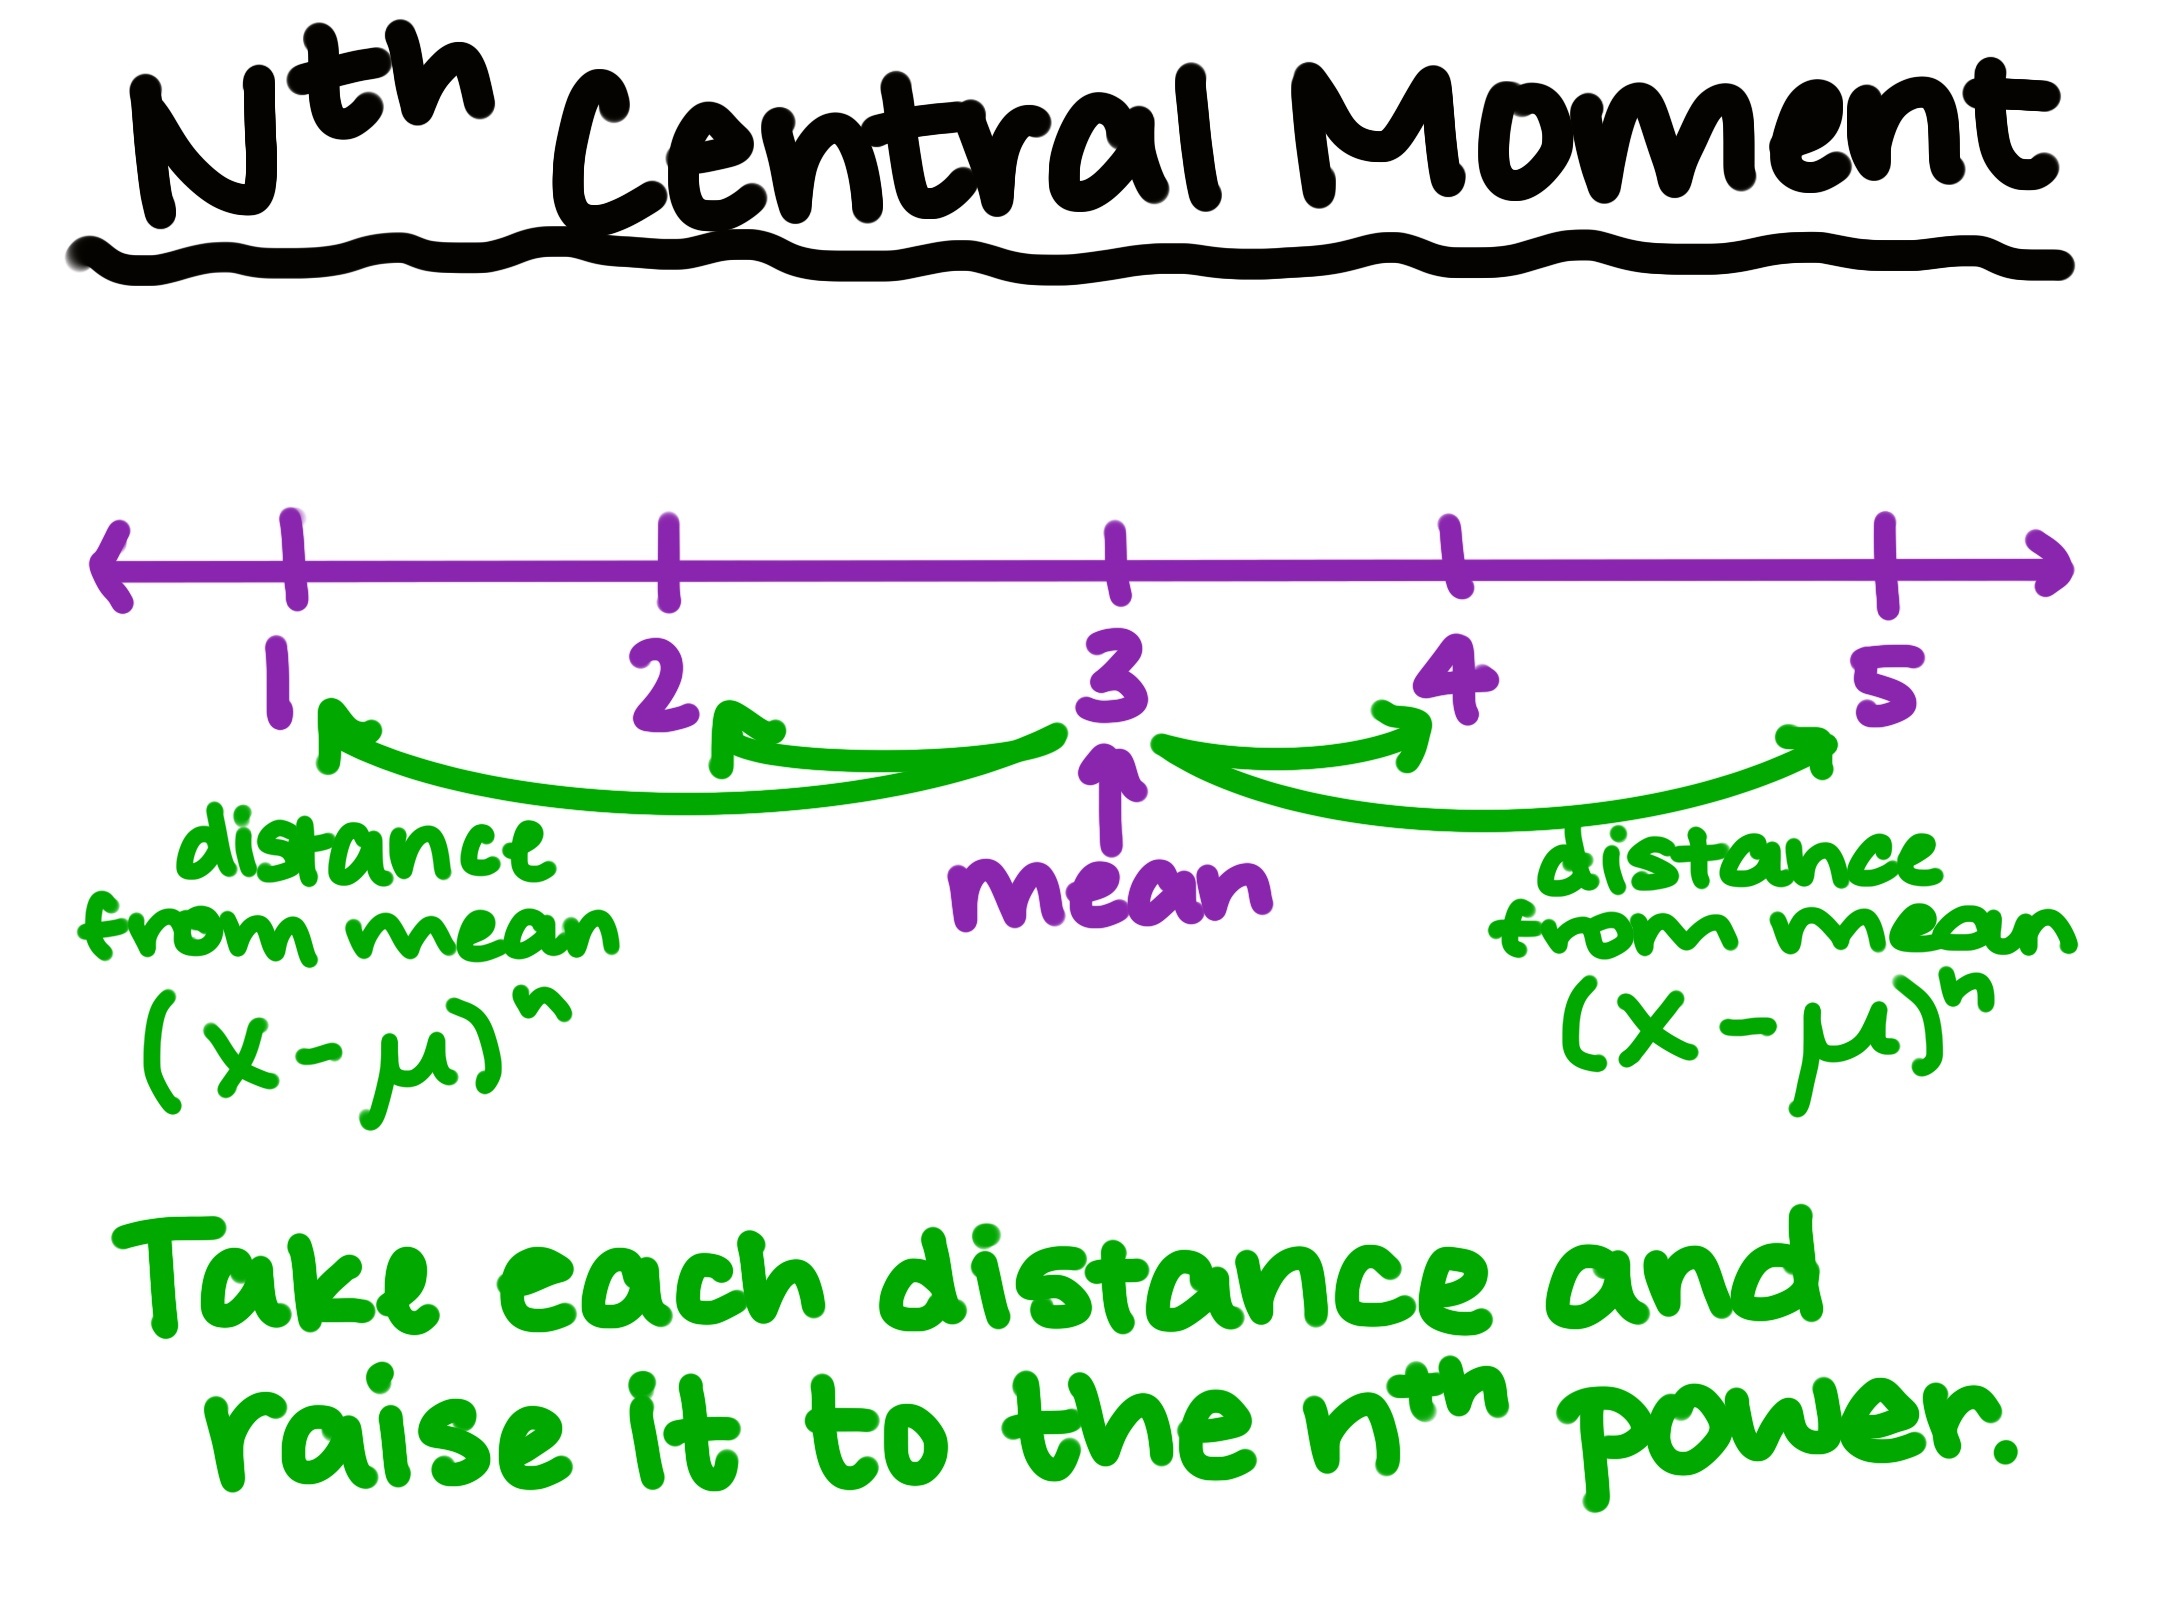
The nth central moment is a number that helps us to describe the shape of a probability distribution. It is based on how far each value is from the mean. You may already know that the mean tells us the center of a data set or random variable. The first step in finding a central moment is to find this mean.
For a random variable , the mean is written as . We then look at the difference between each possible value of and the mean. This difference is written as . We raise this difference to a power, called . The central moment is the expected value of this result.
####The Formula
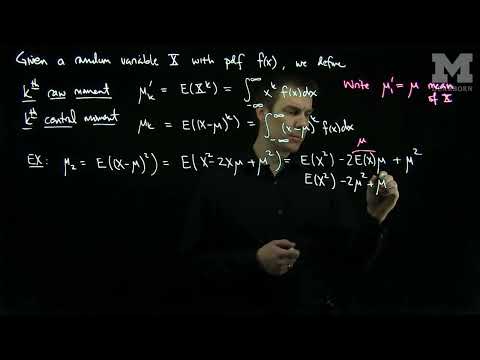
The formula is:
Here, represents the nth central moment. The letter tells us which moment we are finding. For example, the second central moment uses . The second central moment is especially important because it is equal to the variance of the random variable.
The third central moment uses . It can help describe whether a distribution is more stretched to one side than the other. This idea is called skewness. Higher central moments can give us even more information about the shape of a distribution.
To find a central moment, we first find the mean. Next, we subtract the mean from each possible value. Then, we raise each difference to the nth power. Finally, we find the expected value of those results.
Central moments connect several ideas from probability and statistics. They build on expected value, mean, and variance. Later, you can use central moments to study more detailed features of probability distributions. This makes them useful tools for understanding the shape and behavior of random variables.