Illustrated · 2 min
##Finding the Amplitude, Midline, and Period/Frequency of Periodic Graphs
Just as a reminder, periodic functions are functions that repeat itself, most notably trigonometric functions like sine and cosine.
Let's look at an example of a function:

Made using [Desmos] (https://www.desmos.com/calculator)
From this graph, we can see sections of the graph repeating, which are known as periods. However, as mathematicians, we want to quantify these periods, so we use concepts like amplitudes, midlines, and periods to do so.
To better understand the parts of a periodic function, it is useful to think about the standard form of a sine function.
For now, we will ignore the and because those indicate the phase shift of the graph.
Let's start with amplitudes, which is represented by the in the equation.
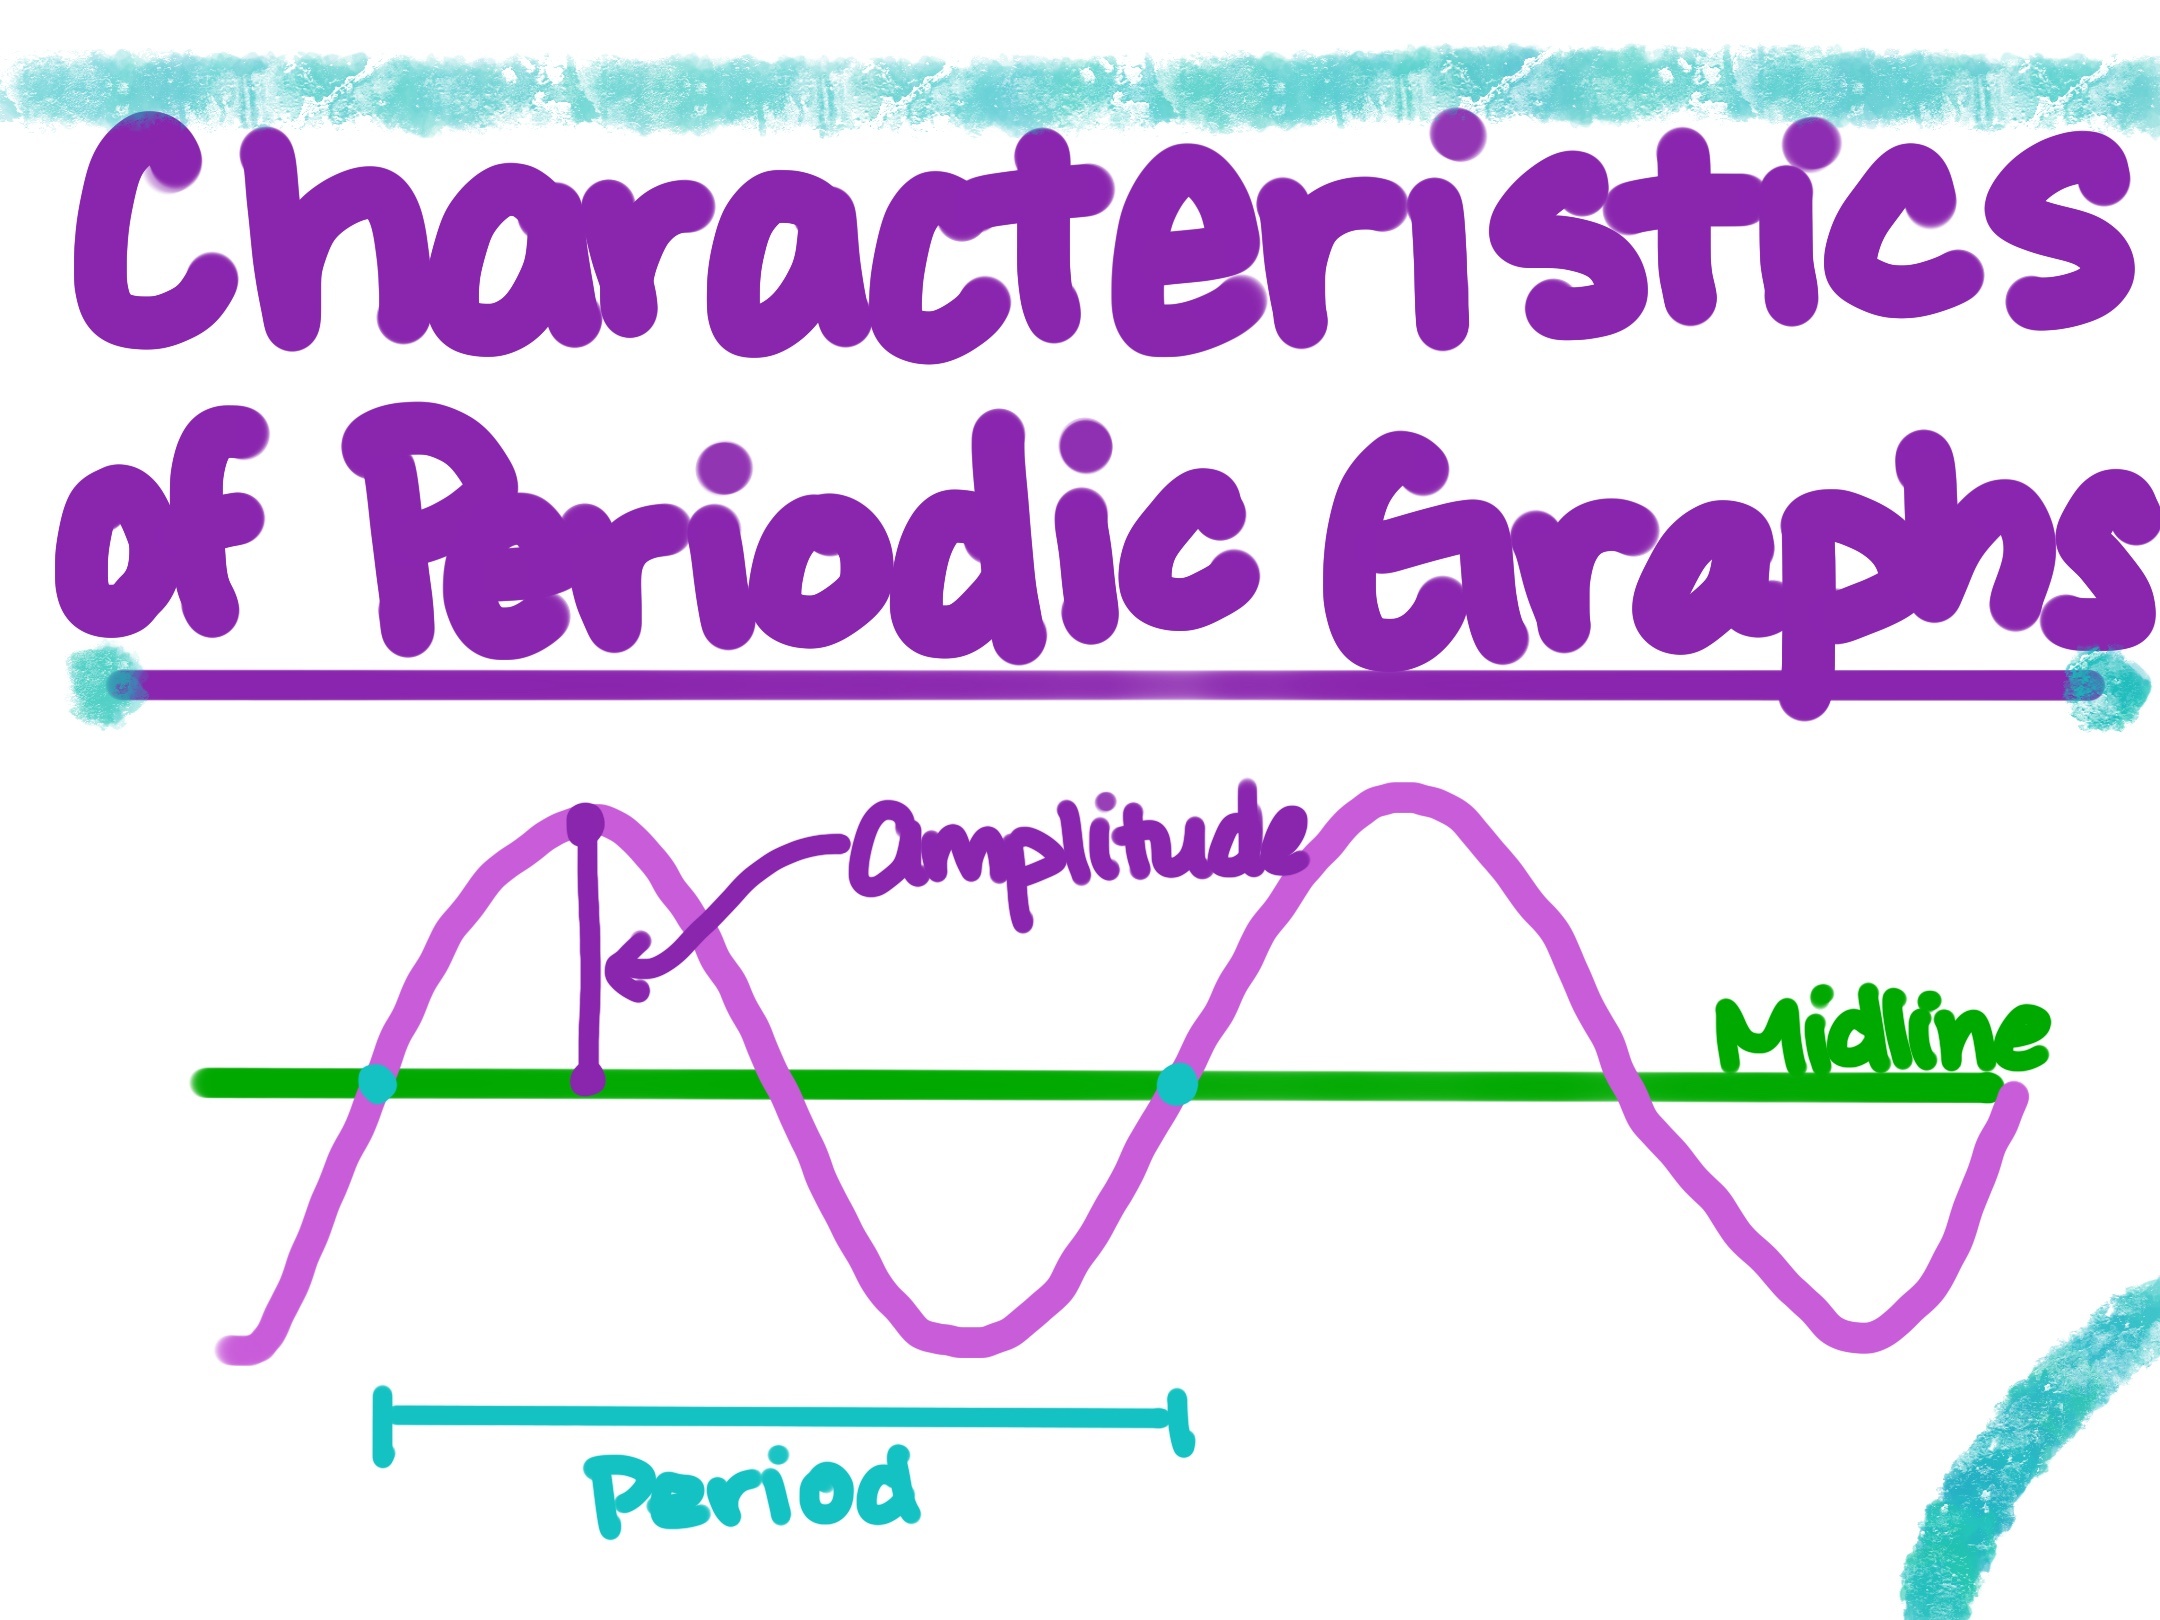
Amplitudes are essentially half the full height of the periodic function. Looking at the graph below, we can see the amplitude labeled. To find the amplitude, you can simply subtract the maximum and minimum, then divide by 2. In other words:
For the sine graph, the amplitude equals .
Now, let's look at the midline. The midline is the middle of the periodic graph. In other words, halfway between the minimum and maximum of the graph. You might notice that the definition of the midline sounds very similar to that of the amplitude, but they're not the same! Essentially, you can add the maximum and minimum, then divide in half.
Notice, the amplitude is subtracting the max and min, while the midline is adding the max and min.
For the sine graph, the midline would be
Lastly, let's find the period of the graph. The period is essentially identifying the subsection of the graph that is being repeated, which is easily identified by finding the distance between two peaks on the graph.
We can find this distance looking at the graph, but sometimes that can be hard, so there is a nifty formula that uses the standard equation of a periodic function to find the period!
Given the function, , we can solve for the period by:
In terms of the sine equation, the period is .
Here's the same graph as above with the amplitude, midline, and period labeled!

Made using [Desmos] (https://www.desmos.com/calculator)