Illustrated · 1 min

We have already learned about how to find increasing and decreasing intervals and relative extrema graphically, so now it's time to learn how to find absolute extrema!

##Absolute extrema

Absolute extrema are the maximum and minimum yy values on a graph. Unlke the relative extrema, these points aren't just the maximum or minimum of a region of a graph, but instead for the whole graph.

##Identifying On a Graph

This is actually pretty easy! You just need to find the highest and lowest yy values of the graph.

Let's look at an example graph of y=x5−4xy=x^5 - 4x with a domain in interval notation of [−1.5,1.5][-1.5, 1.5]. That means that this is a closed interval.
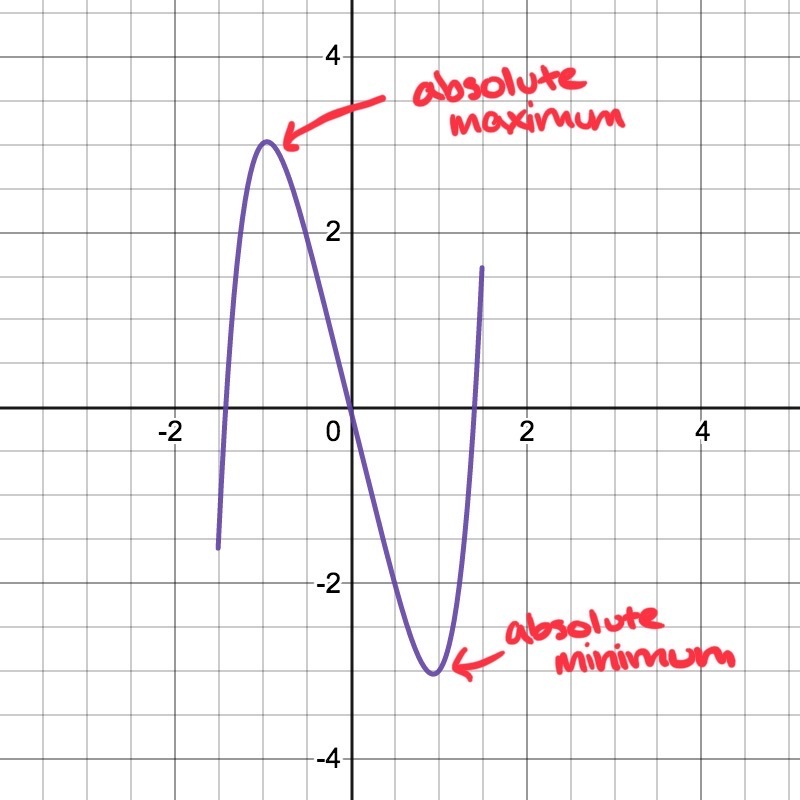
Graph of y = x^5 - 4x with a domain of x is greater than or equal to -1.5 and less than or equal to 1.5.

The absolute maximum and minimum labeled.

Made using Desmos

We can see the absolute maximum and absolute minimum labelled on the graph. Note that we restricted the domain because if the domain wasn't restricted, the graph would go to negative and positive infinity, which isn't defined.
Illustrated · 1 min

Absolute Extrema

We can use qualitative methods to find the absolute extrema of a function.

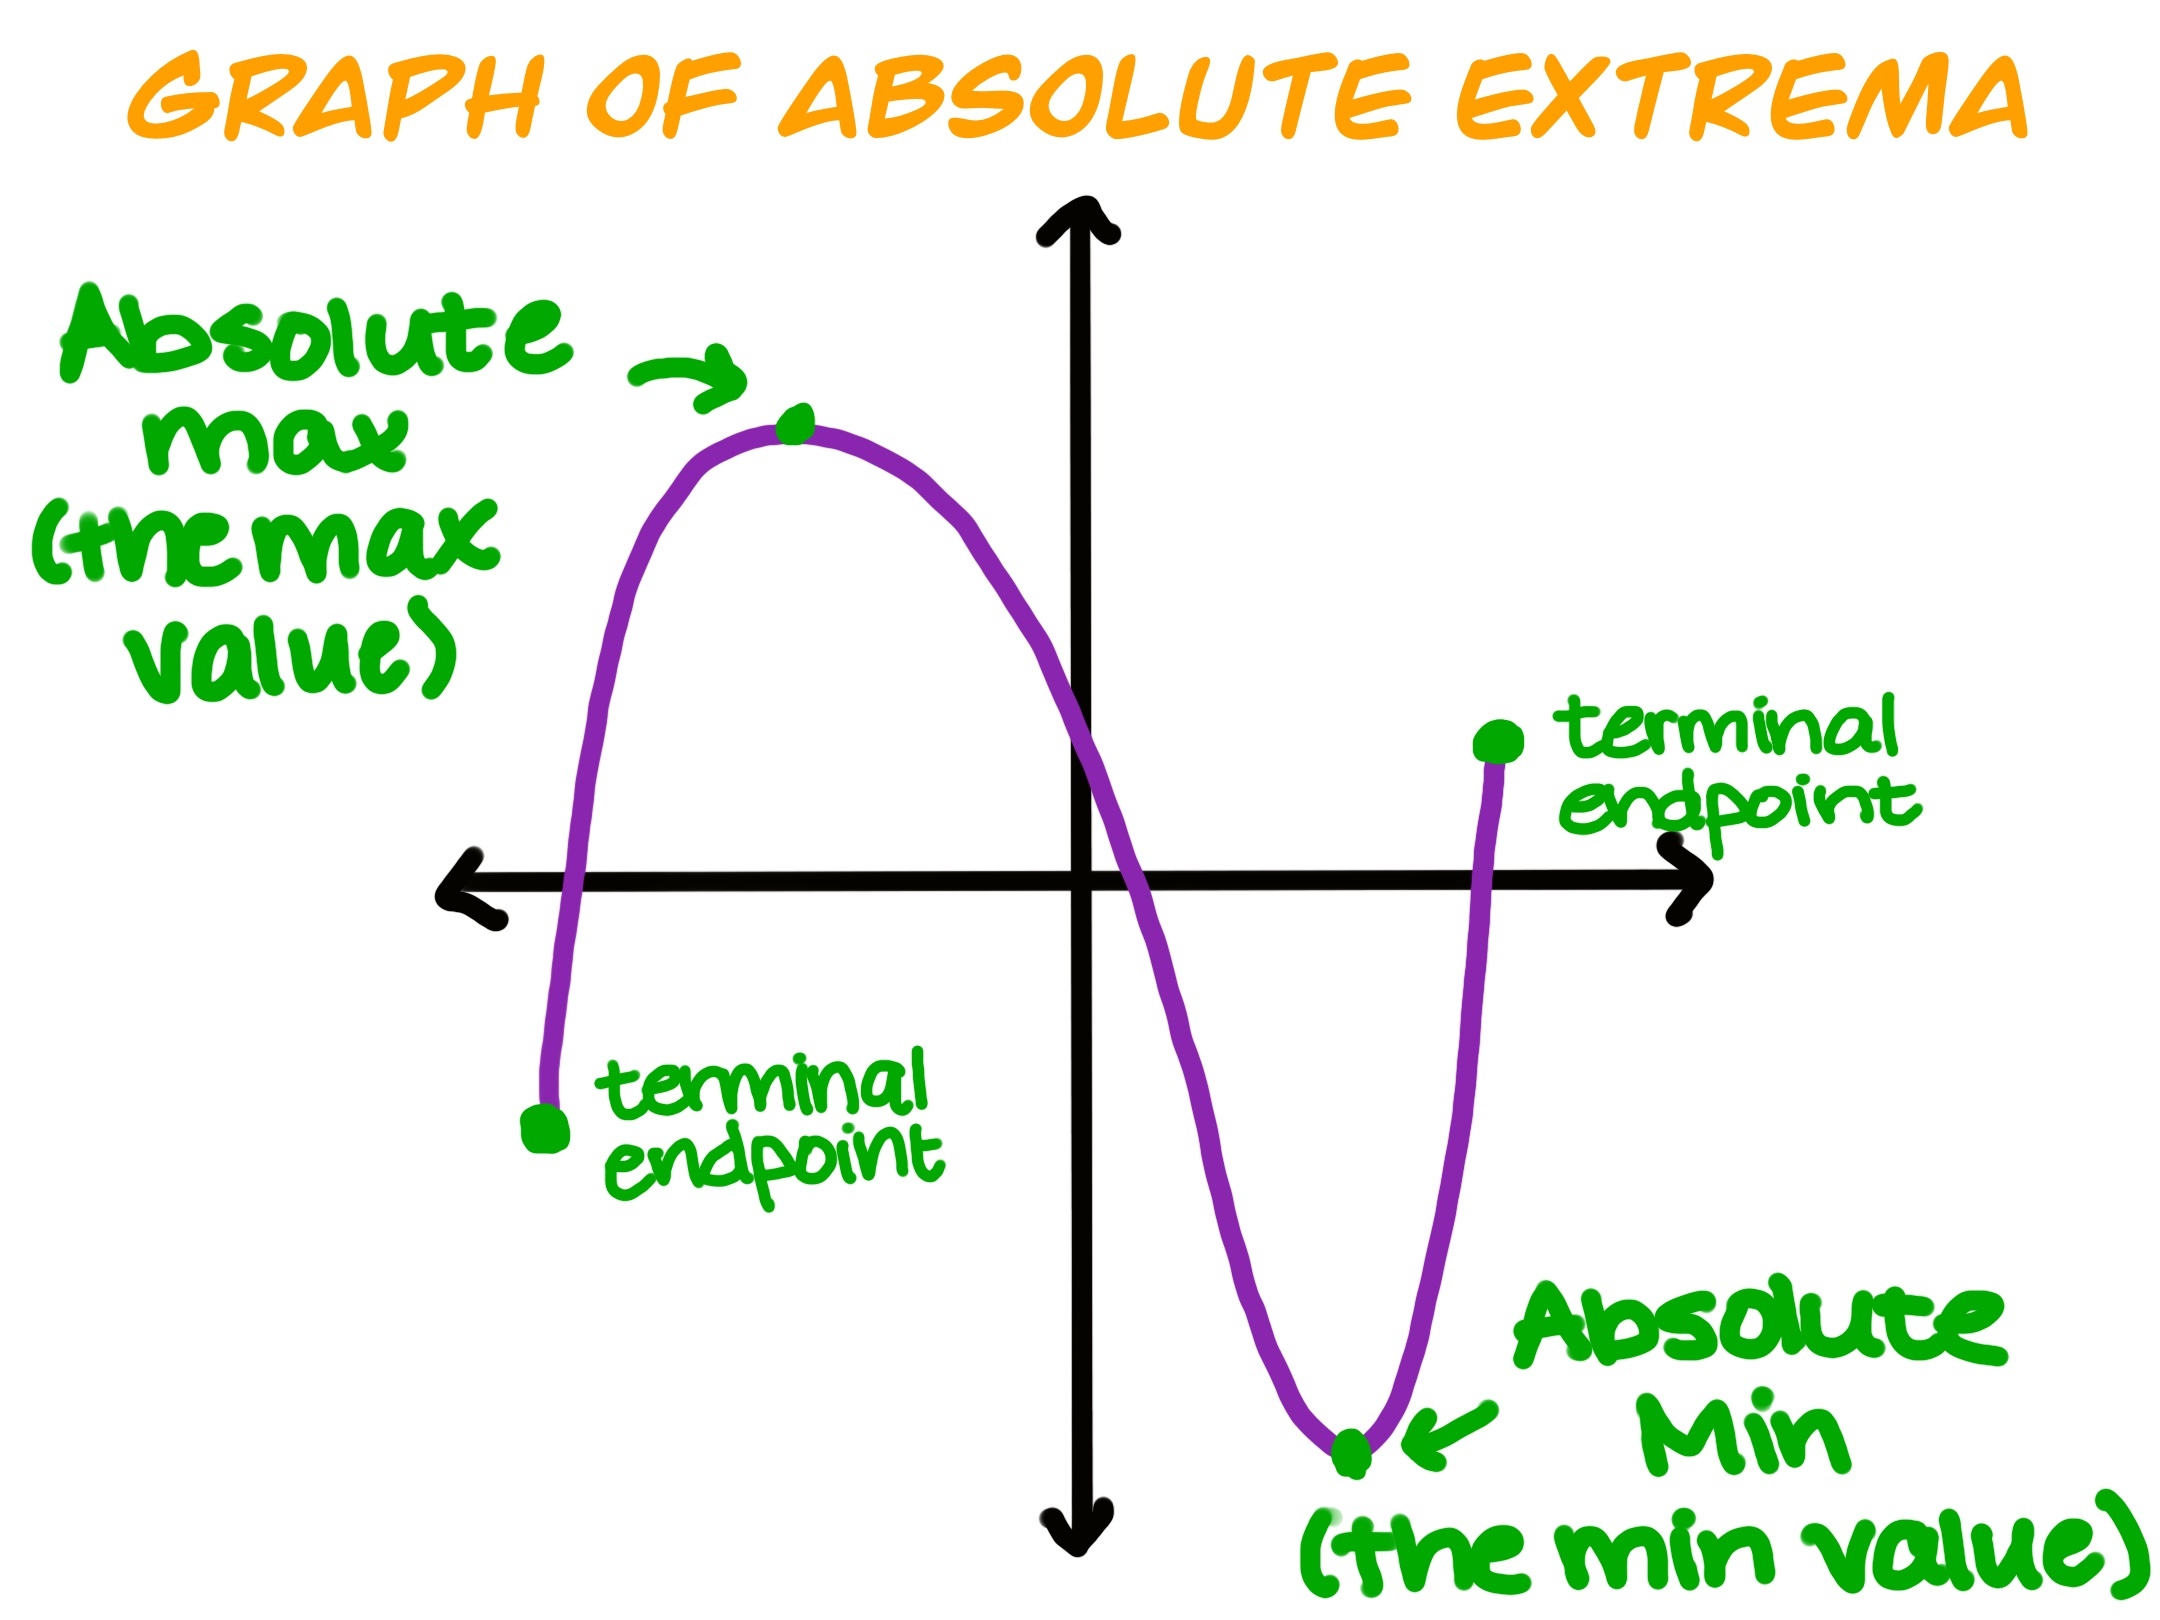
Graph of Absolute Extrema
Points labeled on a graph of a function: absolute max (the max value), terminal endpoint, absolute min (the min value), terminal endpoint

Image source: by Anusha Rahman

Absolute extrema are made up of the absolute maximum value and the absolute minimum value. The absolute max is the highest value that the function can have. Similarly, the absolute min is the lowest value that the function can have.

Video

(Video) Absolute Extrema

by Anusha Rahman

In this video by Anusha Rahman, you will learn about absolute extrema.

Summary

Absolute extrema are the largest and smallest values that a function can have. The absolute extrema can happen at an endpoint.

Type a concept, like “slope” or “photosynthesis”.

↑ ↓ to choose · Enter to openSearch explanations and problems
