Graphically Finding Relative Extrema
Before we find relative extrema, we need to understand increasing and decreasing intervals on a graph.
An increasing interval is where the graph goes up as you move from left to right. A decreasing interval is where the graph goes down.
To find these intervals, look at the slope of the graph:
- A positive slope means the graph is increasing.
- A negative slope means the graph is decreasing.
These intervals help us understand how a function behaves. They also prepare us to find relative maximums and minimums.
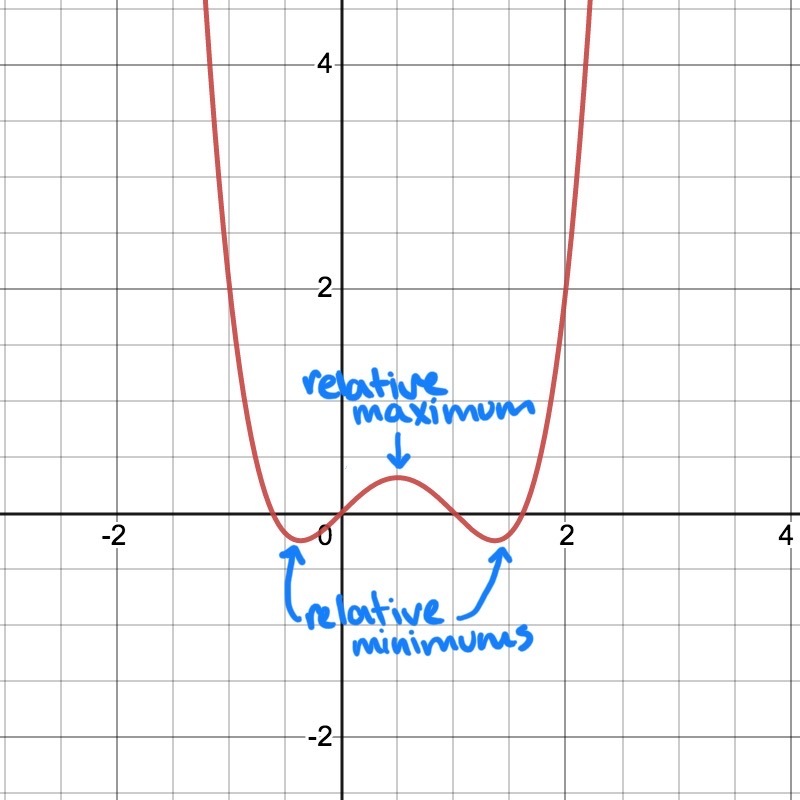
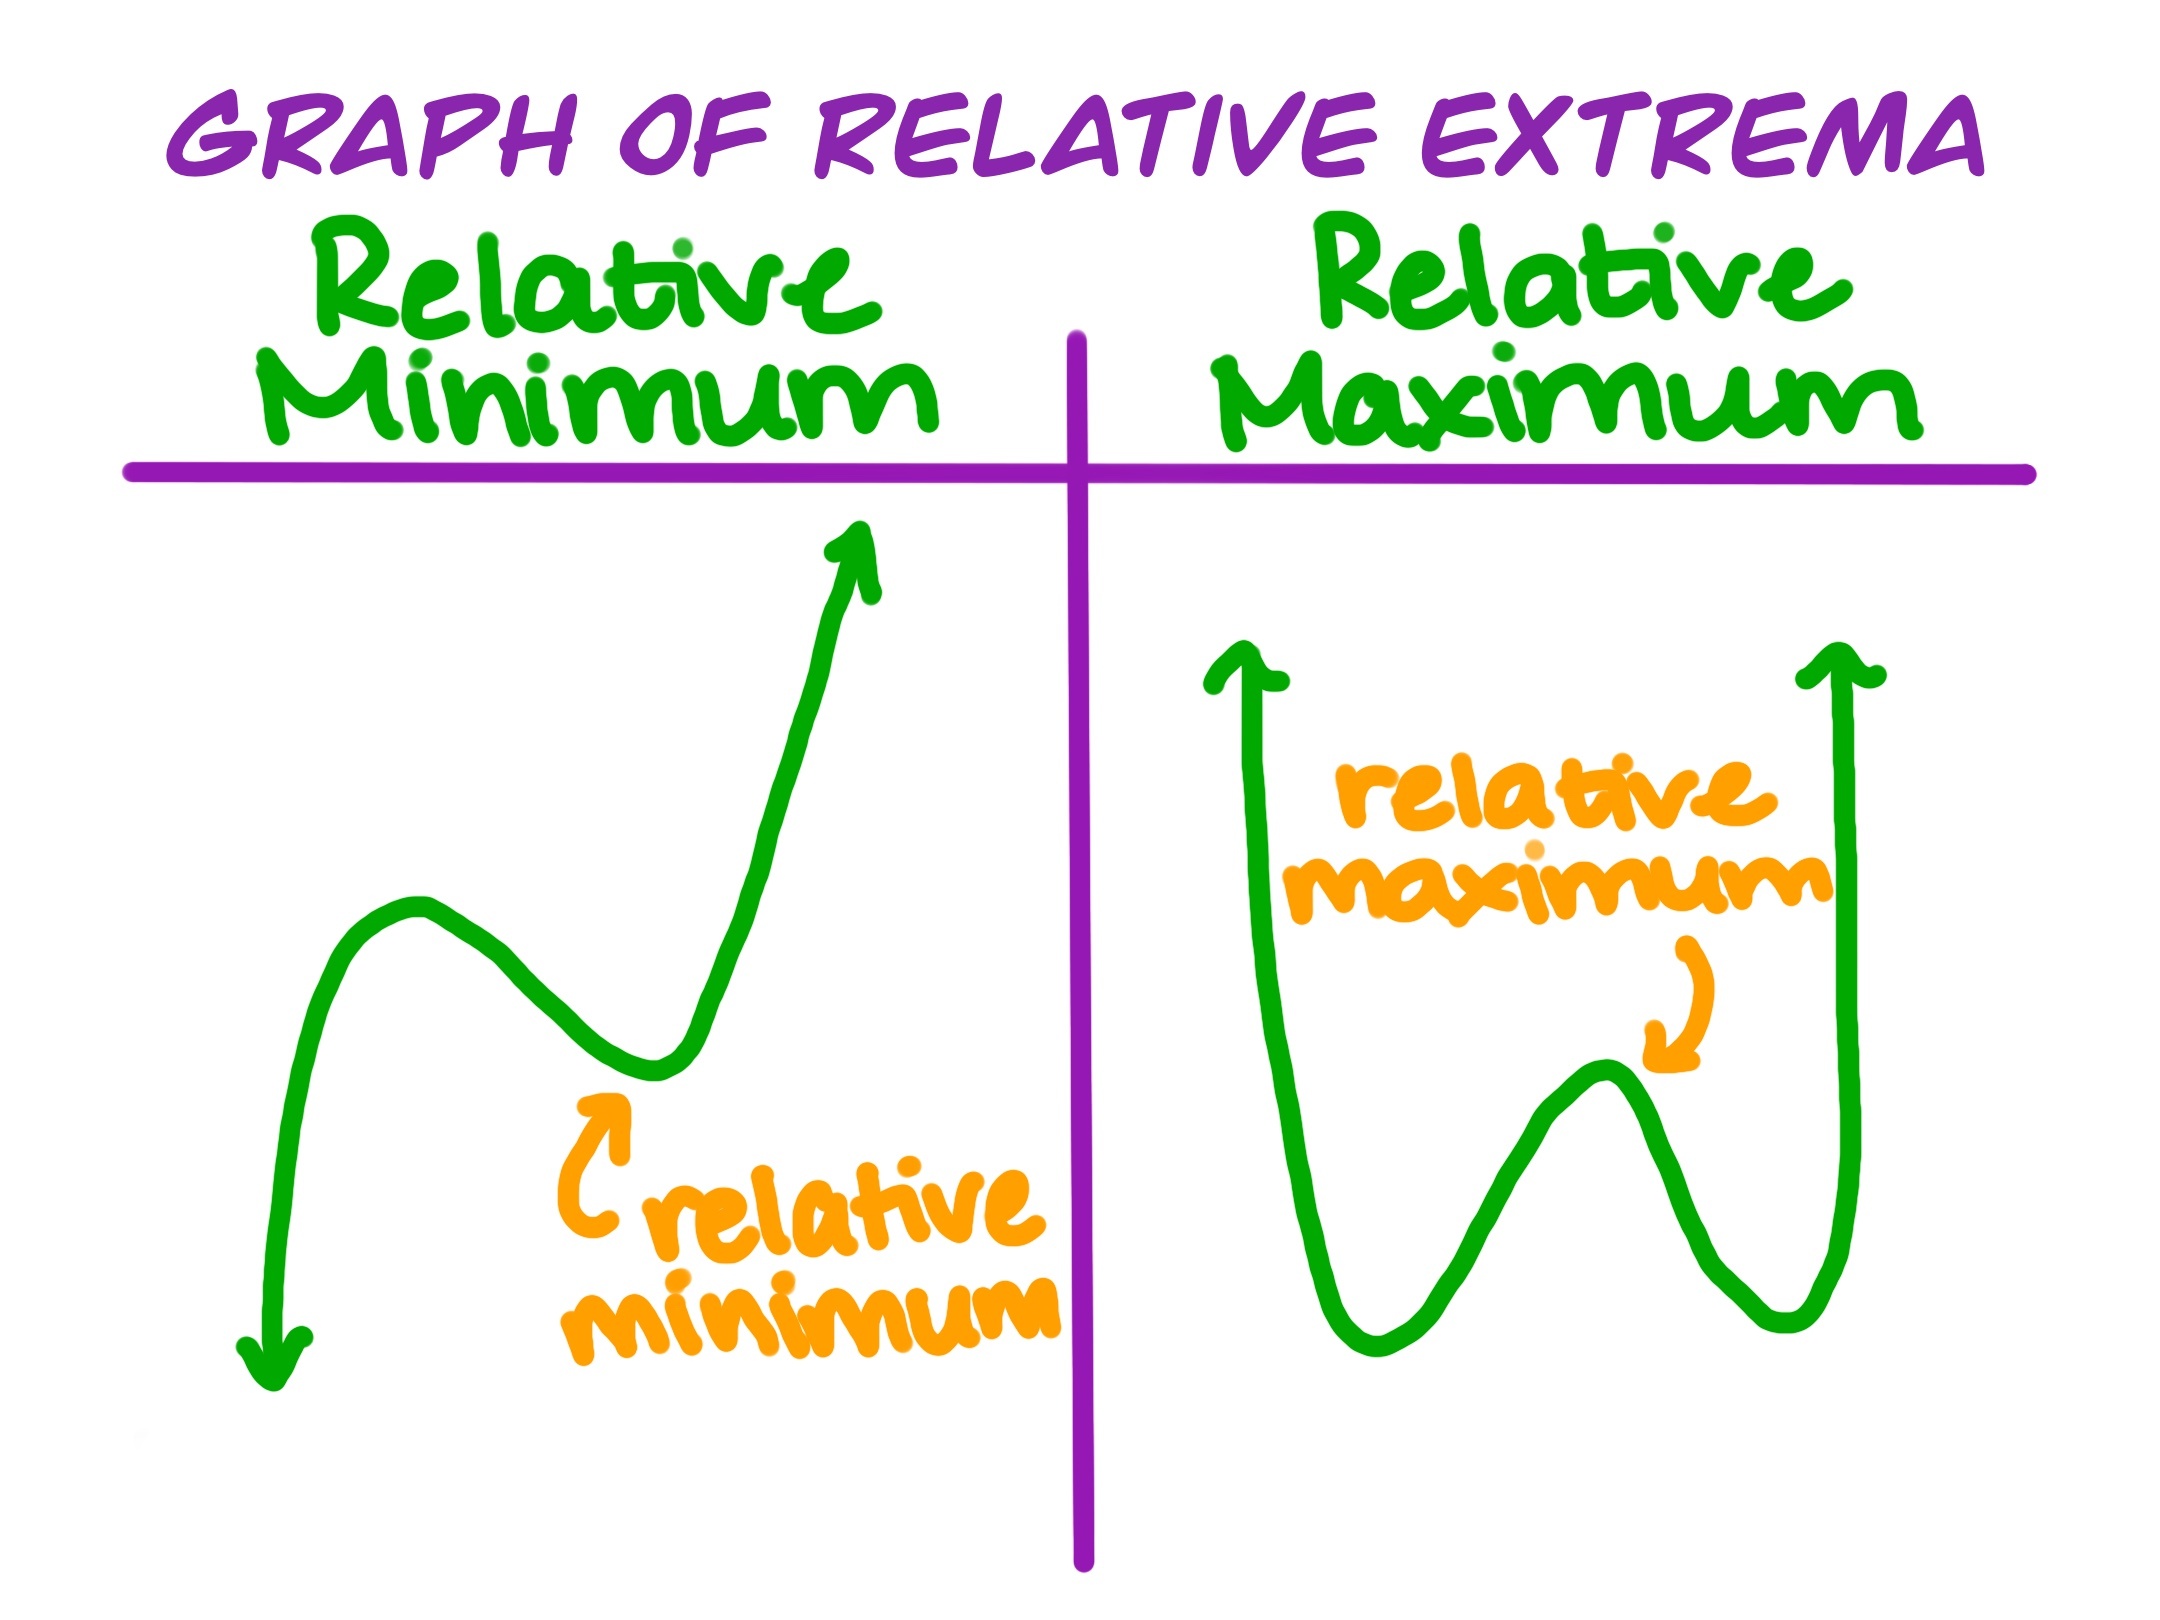
Relative extrema is the general term for the relative minimum and the relative maximum.
When you look at a graph of a function, relative extrema are the highest or lowest points in a certain region of the graph. These points help us understand where the graph changes behavior.
The high points are called relative maxima, and the low points are called relative minima. A graph can have more than one relative maximum or minimum.
To find relative extrema, look for places where the graph changes direction. This happens when the graph switches from going up to down, or from down to up.
At these points, the graph has a horizontal tangent line. This means the graph looks flat for a moment. When this happens, the slope of the graph is zero.
These points are important because they often mark turning points on the graph and help describe how the function behaves.
For example, if the graph goes up, hits a peak, and then goes down, that peak is a relative maximum. If the graph goes down, hits a valley, and then goes up, that valley is a relative minimum.
To identify these points accurately, you can draw a line along the curve and see where it flattens out. Then, check if the direction of the graph changes on either side of that point.
Real World Example
Imagine riding a roller coaster. As the coaster climbs a hill, its height is increasing. We can also think of it as the slope increasing. When it reaches the top of the hill, it stops going up and starts going down.
That top point is a relative maximum. It is the highest point in that part of the ride, even though there might be a taller hill later.
Now think about the bottom of a dip in the track. The coaster stops going down and starts going up again. That point is a relative minimum.
Just like on a graph, these high and low points show where the motion changes direction.
Looking Further
Finding relative extrema graphically has many real-world applications, especially in fields like economics, physics, and engineering.
For example, in economics, identifying relative maxima and minima can help businesses determine the highest profit or the lowest cost.
In physics, relative extrema can represent points where a moving object reaches its highest or lowest speed.
More advanced mathematics, like calculus, builds on this concept to find critical points and analyze curves, helping engineers design optimized systems or predict how systems will behave under certain conditions.
So What
Understanding how to find relative extrema on a graph is a powerful skill. It helps you make sense of real-world situations.
When you learn this, you are not just solving math problems. You are learning how to understand and solve problems in science, business, and many other areas.
This skill also gives you a strong foundation for more advanced topics in calculus. With practice, you’ll be able to approach harder problems with confidence.