Illustrated · 1 min

Graphing Ellipses from an Equation
We know that the general form of an ellipse equation is:
, where is the semi-major axis (half the length of the longest diameter) and is the semi-minor axis (half the length of the shortest diameter.
There are six steps we will follow to graph an ellipse!
1. Identify the center
The center of the ellipse is at
2. Find the length of the major and minor axes
tells us how far the ellipse extends horizontally from the center, and tells you har far it extends vertically from the center.
3. Find the direction of the major axis
The major axis is the longest diameter of the ellipse. If , then the major axis lies along the -axis. If , then the major axis lies along the -axis.
4. Plot the vertices
Vertices are where the ellipse intersects the major axis. They are located units away from the center along the major axis.
5. Plot the co-vertices
The co-vertices are the points where the ellipse intersects the minor axis. They are located units away from the center along the minor axis.
6. Draw the ellipse
Connect the points smoothly! Make sure the curve is symmetrical on both axes.
Example
Graph the ellipse with the equation:
1. Identify the center
The ellipse is centered at the origin, , as and .
2. Find the length of the major and minor axes
and
3. Find the direction of the major axis
Since , the major axis lies along the -axis.
4. Plot the vertices
The vertices are at
5. Plot the co-vertices
The co-vertices are at
6. Draw the ellipse
Let's first plot all the points, then we can see what the ellipse looks like!
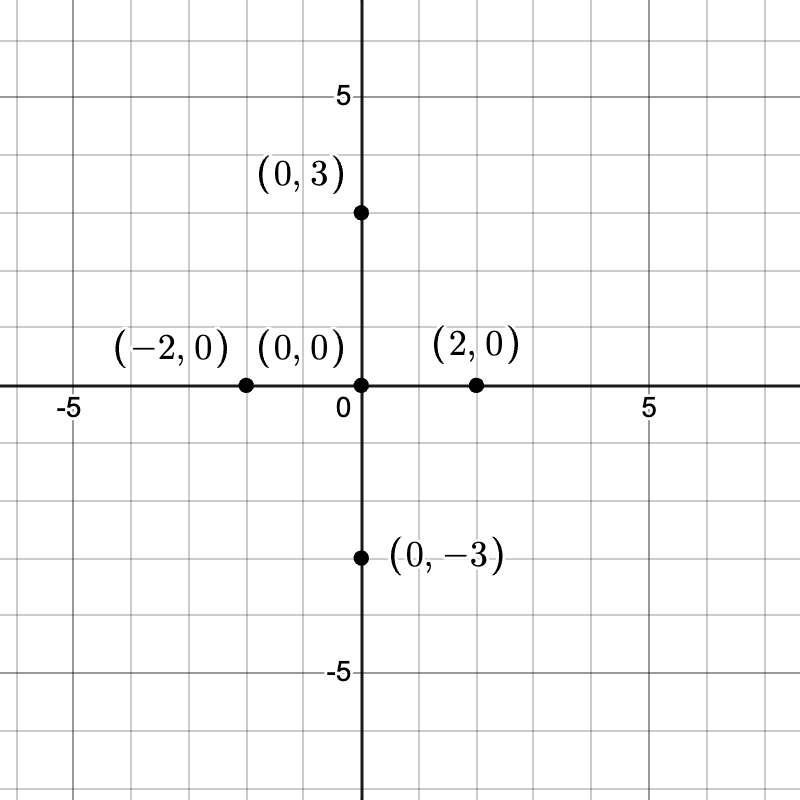
Graph made using Desmos
Now that we have our points plotted, we can connect the dots and sketch our curve!
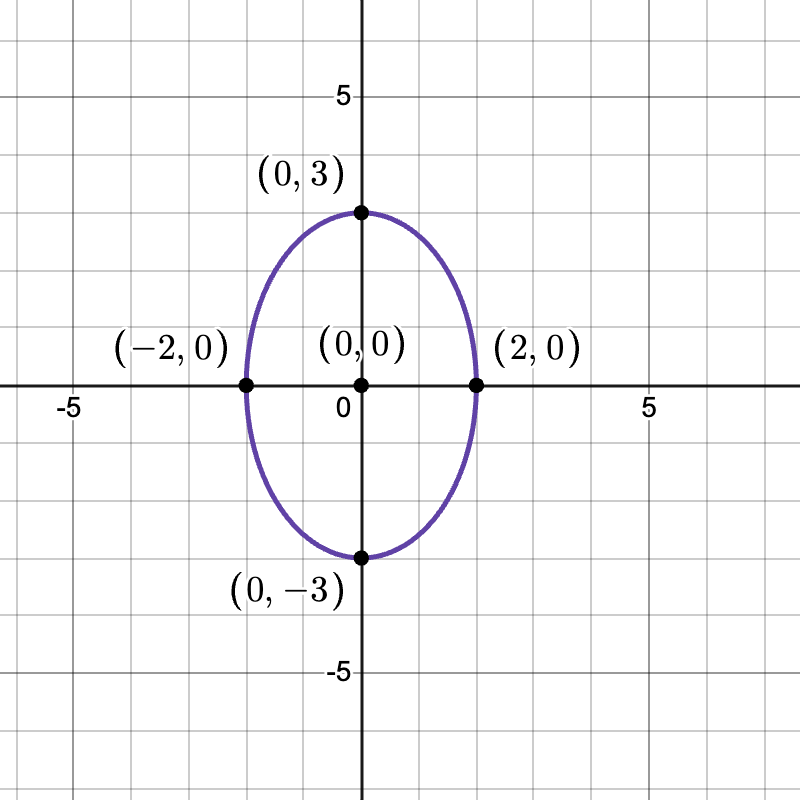
Graph made using Desmos