Video

(Video) Basic Graphing of Parametric Curves

by patrickJMT

This video by patrickJMT walks you through an example of how to graph parametric curves.

Summary

Parametric curves are often used to describe curves in a plan that aren't functions. Say we have,

x=f(t)y=f(t)\begin{align} x &= f(t) \\ y &= f(t) \\ \end{align}

We will often see these for graphs with lots of movement in two-dimensions.

Let's walk through how we would graph parametric curves.

Sketch the curve of the following set of parametric equations:

x=1+ty=t2−4t\begin{align} x &= 1 + \sqrt{t} \\ y &= t^2 -4t \\ \end{align}

over the interval 0≤t≤50 \leq t \leq 5.

The first thing we want to do is to create a t-chart of our values.

txy01012−3430\begin{array}{r|l} t&x&y \\ \hline 0&1&0 \\ 1&2&-3 \\ 4&3&0 \\ \end{array}

t=0t=0 is the initial point, and t=5t=5 is the terminal point.

We will then only graph the xx and yy coordinate points, (x,y)(x,y).

Try the next example on your own! Graph the set of equations:

x=ty=1−t\begin{align} x &= \sqrt{t} \\ y &= 1-t \\ \end{align}

Once you try graphing the curve of the pair of parametric equations, follow along with the video to see how you did!

Illustrated · 1 min

So far, we've learned about how to graph curves for rectangular equations, which are our typical xx and yy functions. But there is another type of curve that we can graph, which is very similar to curves for rectangular equations, but there's a slight difference.

Previously, we learned what parametric equations are, essentially mapping our xx and yy coordinates to a third variable, typically tt. We see parametric equations a lot with projectile word problems because of the relationship between vertical velocity, horizontal velocity, and time.

One thing to note: Rewriting parametric equations as rectangular equations helps explain the shape of the graph. The opposite could also happen. Some curves are easier to graph after finding parametric equations from rectangular equations.

It may seem like since we have three variables in parametric equations, we will have a plane with an xx-axis, yy-axis, and zz-axis! That's not the case here, thankfully, as that would get really complicated! Instead, we will find the corresponding points for our third variable, tt, and then graph the xx and yy values.

Sounds confusing, doesn't it? Let's talk it through.

Let's say we have the following two equations:

x=t+2y=t2+3\begin{align} x &= t+2 \\ y &= t^2 +3 \\ \end{align}

At this point, we can't graph these two equations on a coordinate plane. However, we can create a t-chart to understand the relationship between all three variables. If we select a few points for tt, since that's the common variable, we can solve for corresponding values for both xx and yy. I randomly picked −1-1, 00, 11, and 22 as values for tt.

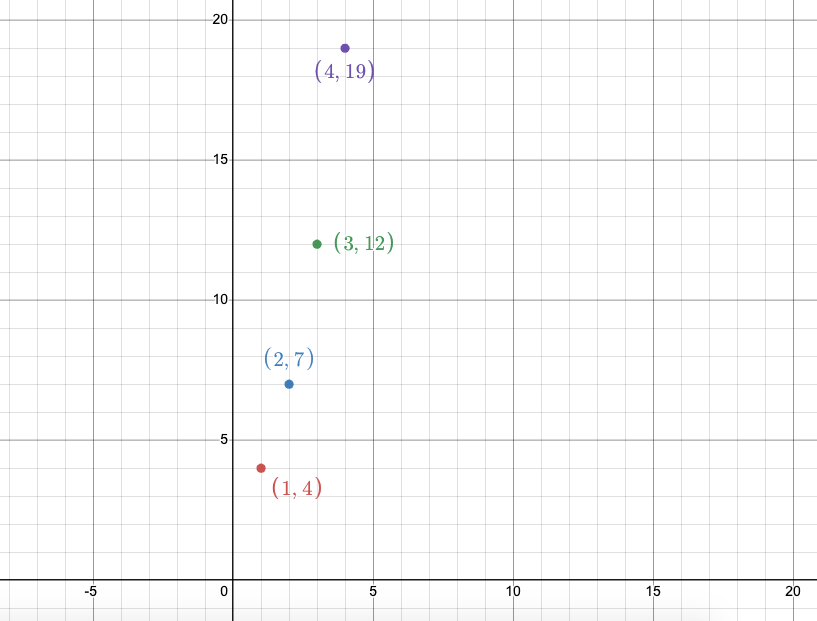
txy−11402713122419\begin{array}{r|l} t&x&y \\ \hline -1&1&4 \\ 0&2&7 \\ 1&3&12 \\ 2&4&19 \\ \end{array}

We can see that we now have the familiar (x,y)(x,y) coordinates! We can plot these points on a graph. Let's try sketching the graph:

Plotted points: (1,4), (2,7), (3, 12), and (4,19)

Made using Desmos

Illustrated · 1 min

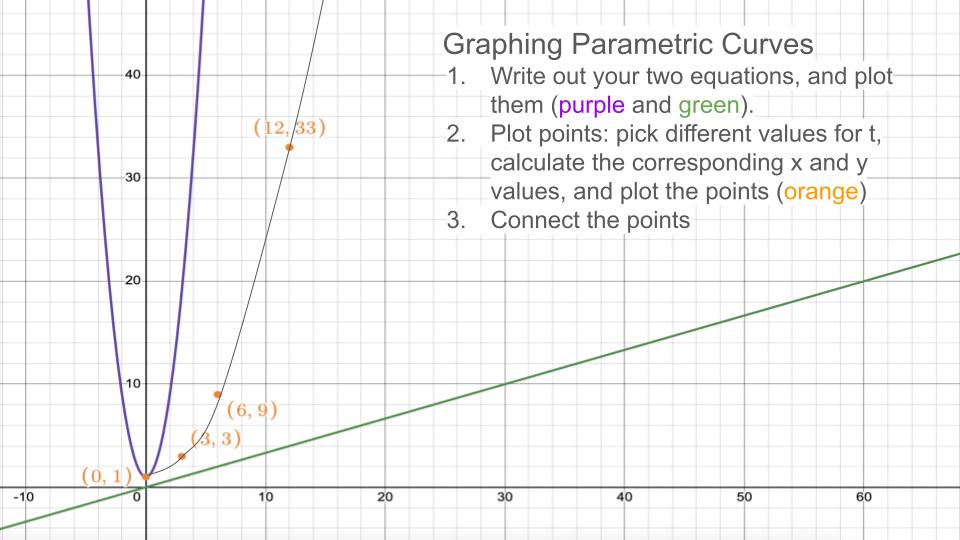
Graphing Parametric Curves

On the graph, you'll see two axes: the xx-axis (horizontal) and the yy-axis (vertical). In parametric equations, the xx and yy coordinates of points on the curve are given as separate equations, often in terms of a parameter, usually tt.

To graph a curve accurately, you must first focus on parametrizing the curve.

Graphing Parametric Curves
Write out your two equations, and plot them (purple and green). 
Plot points: pick different values for t, calculate the corresponding x and y values, and plot the points (orange)
Connect the points

Image source: by Anusha Rahman, made using Desmos

Steps:

  1. You might be given two equations that describe the xx and yy positions of a point as a function of tt.
  2. To graph the curve, you pick different values for tt, calculate the corresponding xx and yy values, and plot those points on the graph. Continue this process for other tt values.
  3. After plotting enough points for different values of tt, connect them smoothly to form the parametric curve. The shape of the curve depends on the equations you're working with.

The direction in which you trace the curve is important because the parameter tt shows how the point moves over time. The points you plot in order from the smallest to the largest value of tt show the path the curve takes.

Type a concept, like “slope” or “photosynthesis”.

↑ ↓ to choose · Enter to openSearch explanations and problems