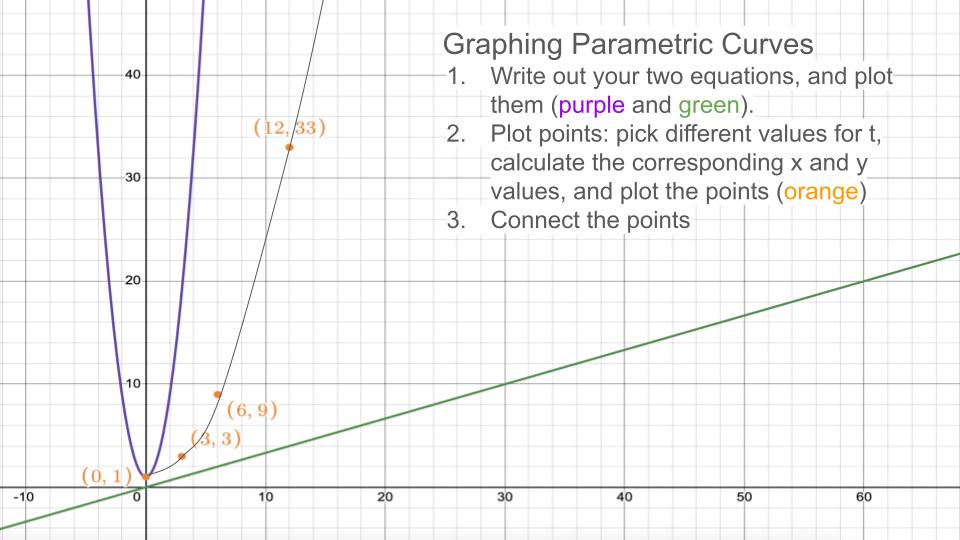
So far, we've learned about how to graph curves for rectangular equations, which are our typical x and y functions. But there is another type of curve that we can graph, which is very similar to curves for rectangular equations, but there's a slight difference.
Previously, we learned what parametric equations are, essentially mapping our x and y coordinates to a third variable, typically t. We see parametric equations a lot with projectile word problems because of the relationship between vertical velocity, horizontal velocity, and time.
One thing to note: Rewriting parametric equations as rectangular equations helps explain the shape of the graph. The opposite could also happen. Some curves are easier to graph after finding parametric equations from rectangular equations.
It may seem like since we have three variables in parametric equations, we will have a plane with an x-axis, y-axis, and z-axis! That's not the case here, thankfully, as that would get really complicated! Instead, we will find the corresponding points for our third variable, t, and then graph the x and y values.
Sounds confusing, doesn't it? Let's talk it through.
Let's say we have the following two equations:
xy=t+2=t2+3
At this point, we can't graph these two equations on a coordinate plane. However, we can create a t-chart to understand the relationship between all three variables. If we select a few points for t, since that's the common variable, we can solve for corresponding values for both x and y. I randomly picked −1, 0, 1, and 2 as values for t.
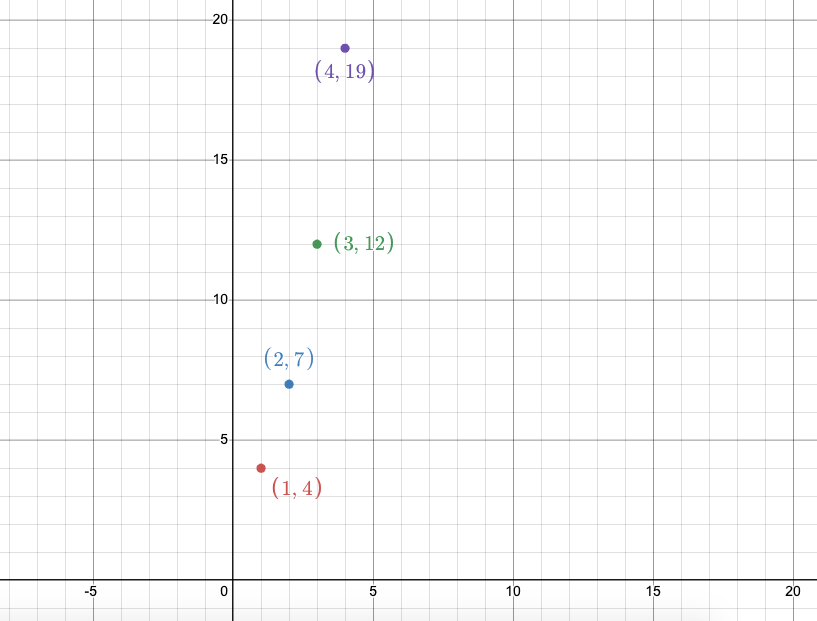
t−1012x1234y471219
We can see that we now have the familiar (x,y) coordinates! We can plot these points on a graph. Let's try sketching the graph: