
Illustrated · 2 min
+1 contributors

We have learned to graph a variety of trig functions, like sine and cosine, but now let's learn how to graph the reciprocal functions: secant, cosecant, and cotangent.
##Graph the Secant Function
To graph any of the reciprocal trig functions, start off with the parent function of the corresponding sine, cosine, or tangent graph.
Let's start off with graphing secant. The reciprocal of secant is cosine, and we have already learned how to graph cosine.

Made using Desmos
We know that . Therefore, we know secant is undefined when cosine is 0. In other words, there will be a vertical asymptote wherever cosine is 0. Looking at the parent graph of above, we can see that there will be vertical asymptotes in the graph of secant when .
We know that the reciprocal of one is one, so the wherever or on the graph will be the same point on the secant graph.
Once we have these points written on our graph, we can look at the direction the cosine graph goes, then do the opposite for the secant graph. In other words, when we look at the point where , the graph immediately decreases before and after that point. Therefore, in the secant function, the function will increase before and after the same point.
Using all this information we have gained from the cosine graph, we can now graph secant!

Made using Desmos
In this graph, we can see that the points and are the same in both the cosine and secant graphs. We can also see the asymptotes at
##Graph the Cosecant Function
We can follow a similar process that we did to graph the secant function. We can look at the graph of the reciprocal function of cosecant, which is sine, and look at the -intercepts, points where and , and the end behavior relative to the known points.
Let's look at the graph of .

Made using Desmos
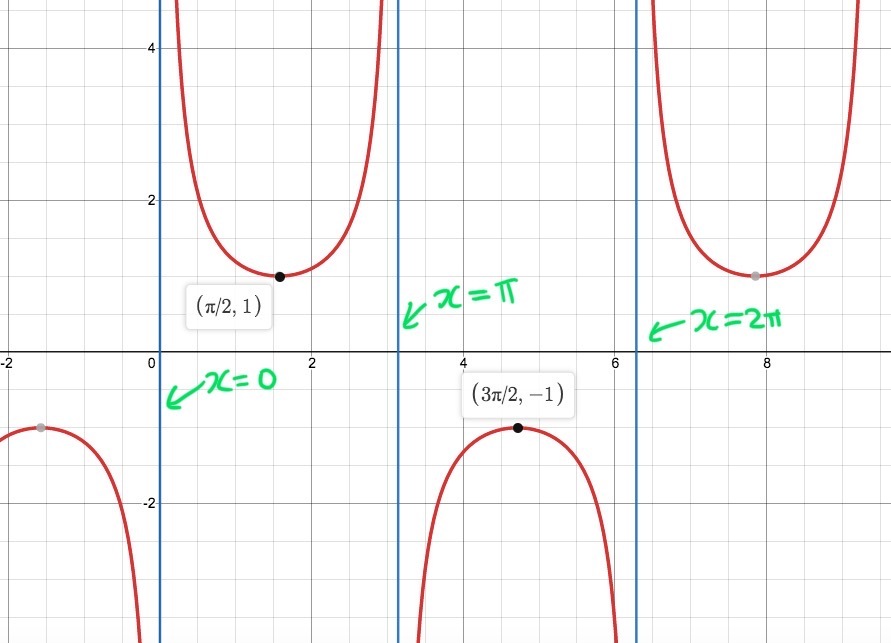
Looking at this graph, we can see that there are -intercepts at , , and . Therefore in the cosecant graph, we know there will be vertical asymptotes at .
We also know that the points and will be the same in the cosecant graph.
Using these two points as a reference point, we can determine the end behavior of the graph. For example, at the point , in the sine function the graph decreases before and after the point. Therefore, in the cosecant graph, the graph will increase before and after this point.
Now, let's graph cosecant!
Made using Desmos
On the graph, we can see the points and labeled along with the asymptotes , and .
##Lastly, Graph Cotangent
By now, you've gotten the hang of it!
Let's check out the graph of .

Made using Desmos
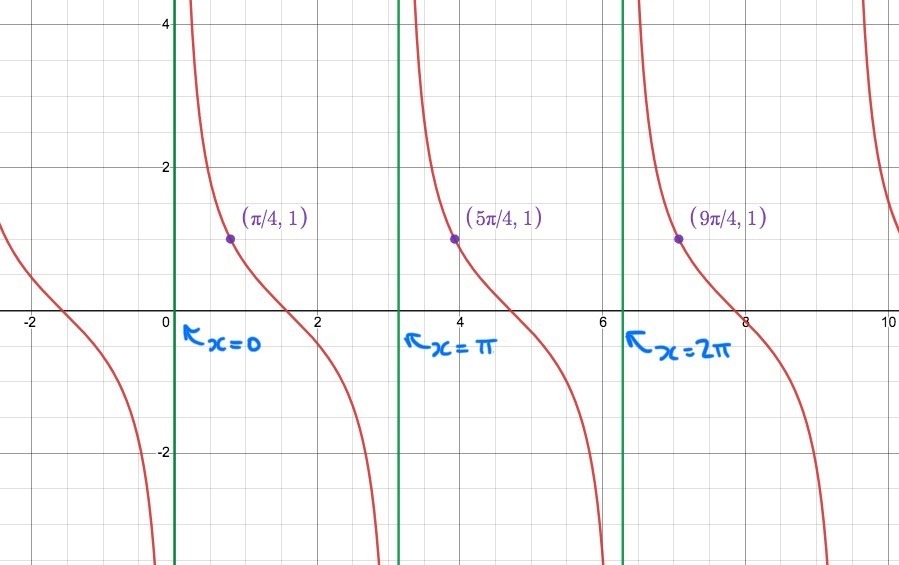
Using the method we learned above, we can graph cotangent:
Made using Desmos
We can see that the -intercepts in the tangent graph are the vertical asymptotes in the cotangent graph. We can also see that the points are the same in both graphs. The end behavior relative to these points is also opposing.


