Video · + 1 min read

+2 contributors


(Video) Graphing Nonlinear Inequalities
by mathman1024

Here's a video by mathman1024 showing you how to graph nonlinear inequalities. The inequality he looks at is . Graphing nonlinear inequalities is pretty much the same as graphing linear inequalities.
- Figure out if you use a dashed line or solid line.
- Graph it as you would if it was an equality.
- Pick a point not on the line to test to see if you shade above or below the line.
Since the inequality uses the symbol , we know the graph’s boundary will be a dashed line. A dashed line means the points on the line are not included in the solution.
Next, draw the graph as if it were an equality. This gives you the basic shape of the graph before shading.
Because this is a quadratic, we need to look at each part of the equation to see how the graph is transformed.
-
The inside the squared term shifts the graph to the right by 2 units.
-
The outside the squared term shifts the graph down by 1 unit.
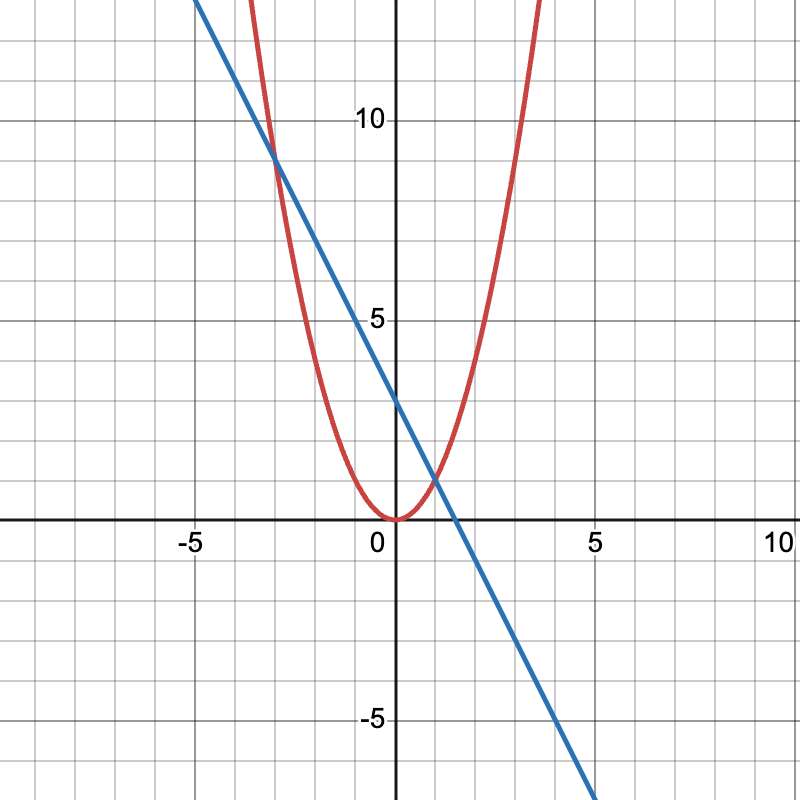
With these shifts, the graph so far will look like this:

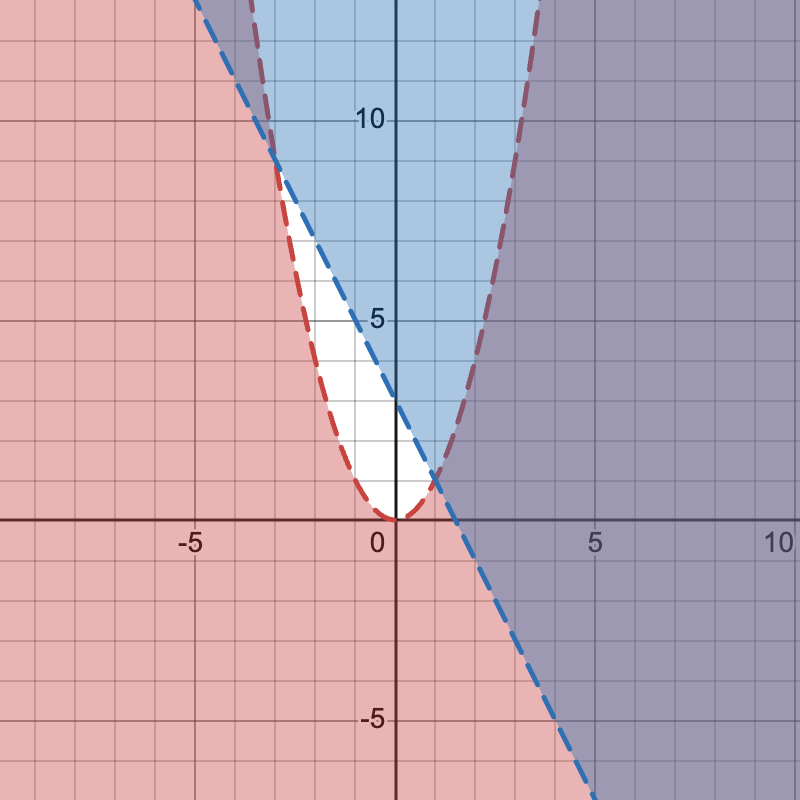
Finally, we pick a point to test to see where the graph should be shaded. Since is not on the parabola, I'll choose that. So is less than ? Yes it is! That means we shade the area outside the graph because that's where the point is located.

Test Yourself: Graph the inequality .
Click continue to see the answer.
Click continue to see the answer!

Moving Forward
If you need a refresher, you can learn to graph systems of nonlinear equations. You can also learn to graph systems of linear inequalities.