Video · + 1 min read

+1 contributors

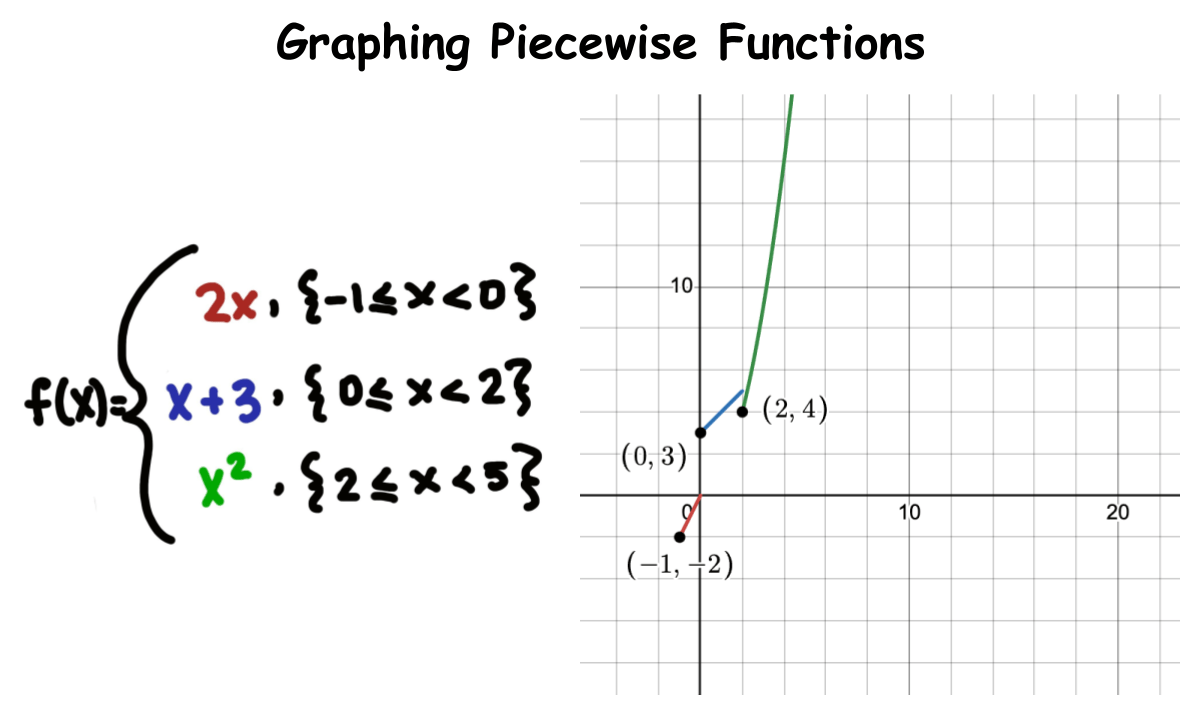
(Video) Graphing Piecewise Defined Functions
by mathman1024

Here's a video by mathman1024 showing you how to graph piecewise functions. A piecewise function is made up of different pieces (crazy isn't it). Each piece tells you what to graph and on what interval to graph. Normally, we didn't have an interval when graphing, we would just have it continue on forever. For piecewise you have to stick to the interval otherwise the graph fails the vertical line test and isn't a function anymore.
In the video he looks at the piecewise function . As you can see there's two different pieces to this graph. At the point the function changes from to .
Let's begin by looking at the first piece: . This graph has a slope of and a y-intercept at . If we were to graph this normally, we'd get:

Made using Desmos
But remember, this piece is only on the interval . So the piecewise function takes the form as long as is less than one.

Made using Desmos
We put an open circle at the end because this part of the graph does not include the point at . Next let's look at the second piece: . Here we have another line with a slope of and a y-intercept at . It's graph would look like:

Made using Desmos
But remember that this second piece is on the interval . So, when the piecewise function is at or above it takes the form .

Made using Desmos
Since the interval contains the point at we do not need an open circle and instead have a closed one. The final step is to combine these graphs together to make the entire piecewise function.

Made using Desmos
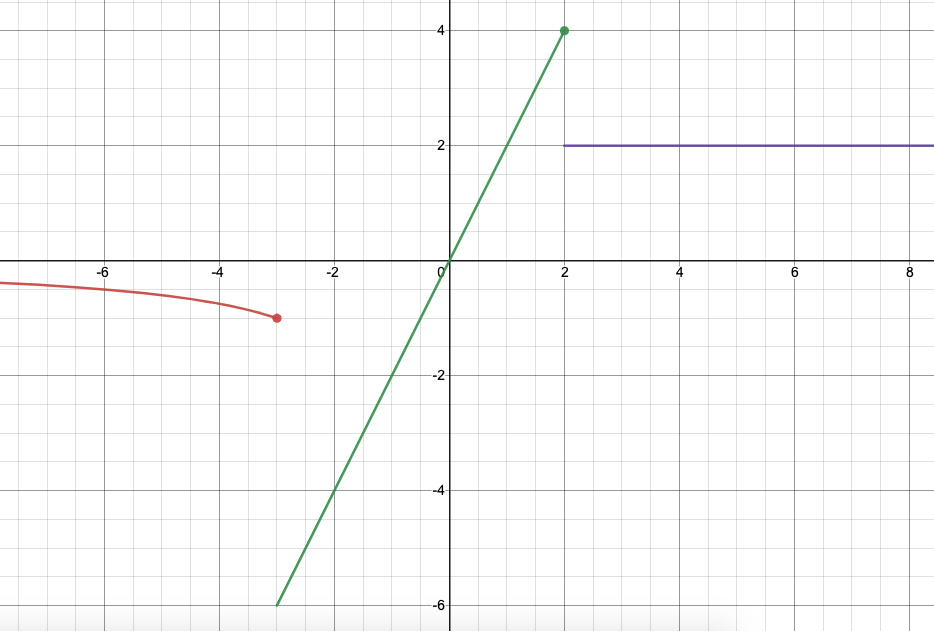
Test Yourself: Graph the piecewise function .

Made using Desmos