Video · + 1 min read
+1 contributors

(Video) An Introduction to Linear Regression Analysis
by statisticsfun
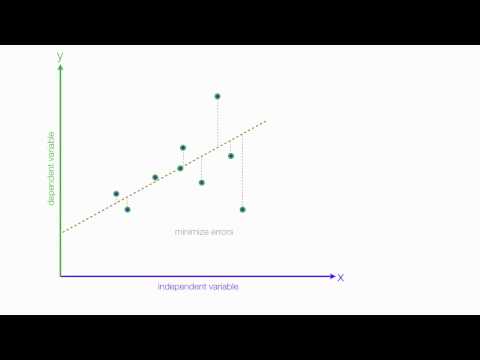
Check out this video by statisticsfun to learn about the basics of linear regression!
Basically, regression is a way to see the relationship between two variables. For example, as the independent variable changes, we should think about how the dependent variable changes.
As the video explains, linear regression is a line that is formed between the two variables and can tell us whether there is a positive, negative, or no relationship. We can use residuals to determine whether the regression line is a good fit for the data.
If both the independent and dependent variables increase, then there is a positive relationship.
If the independent variable increases and the dependent variable decreases, then there is a negative relationship.
There also might not be a clear positive or negative relationship as the regression line might be straight, which would lead to no relationship. Later, we will go further in depth on interpreting linear regression models.
An example given in the video of a positive relationship is study time and grades. An example of a negative relationship is time on Facebook and grades.
The equation of a linear regression is:
Where...
= the dependent variable
= the independent variable
= the -intercept
= slope of the line
Not all relationships between variables are linear - take a look at non-linear regressions!