Video · + 1 min read

(Video) Margin of Error

by Ms. Smith's Math Tutorials

Watch this video to learn more about calculating the margin of error!

First, we need to find the margin of error.

Like Ms. Smith says in her video, a margin of error is a calculation that tells us how much discrepancy is allowed for miscalculation. Often, these miscalculations occur from experimental error in experimental studies, surveys, and other types of sampling.

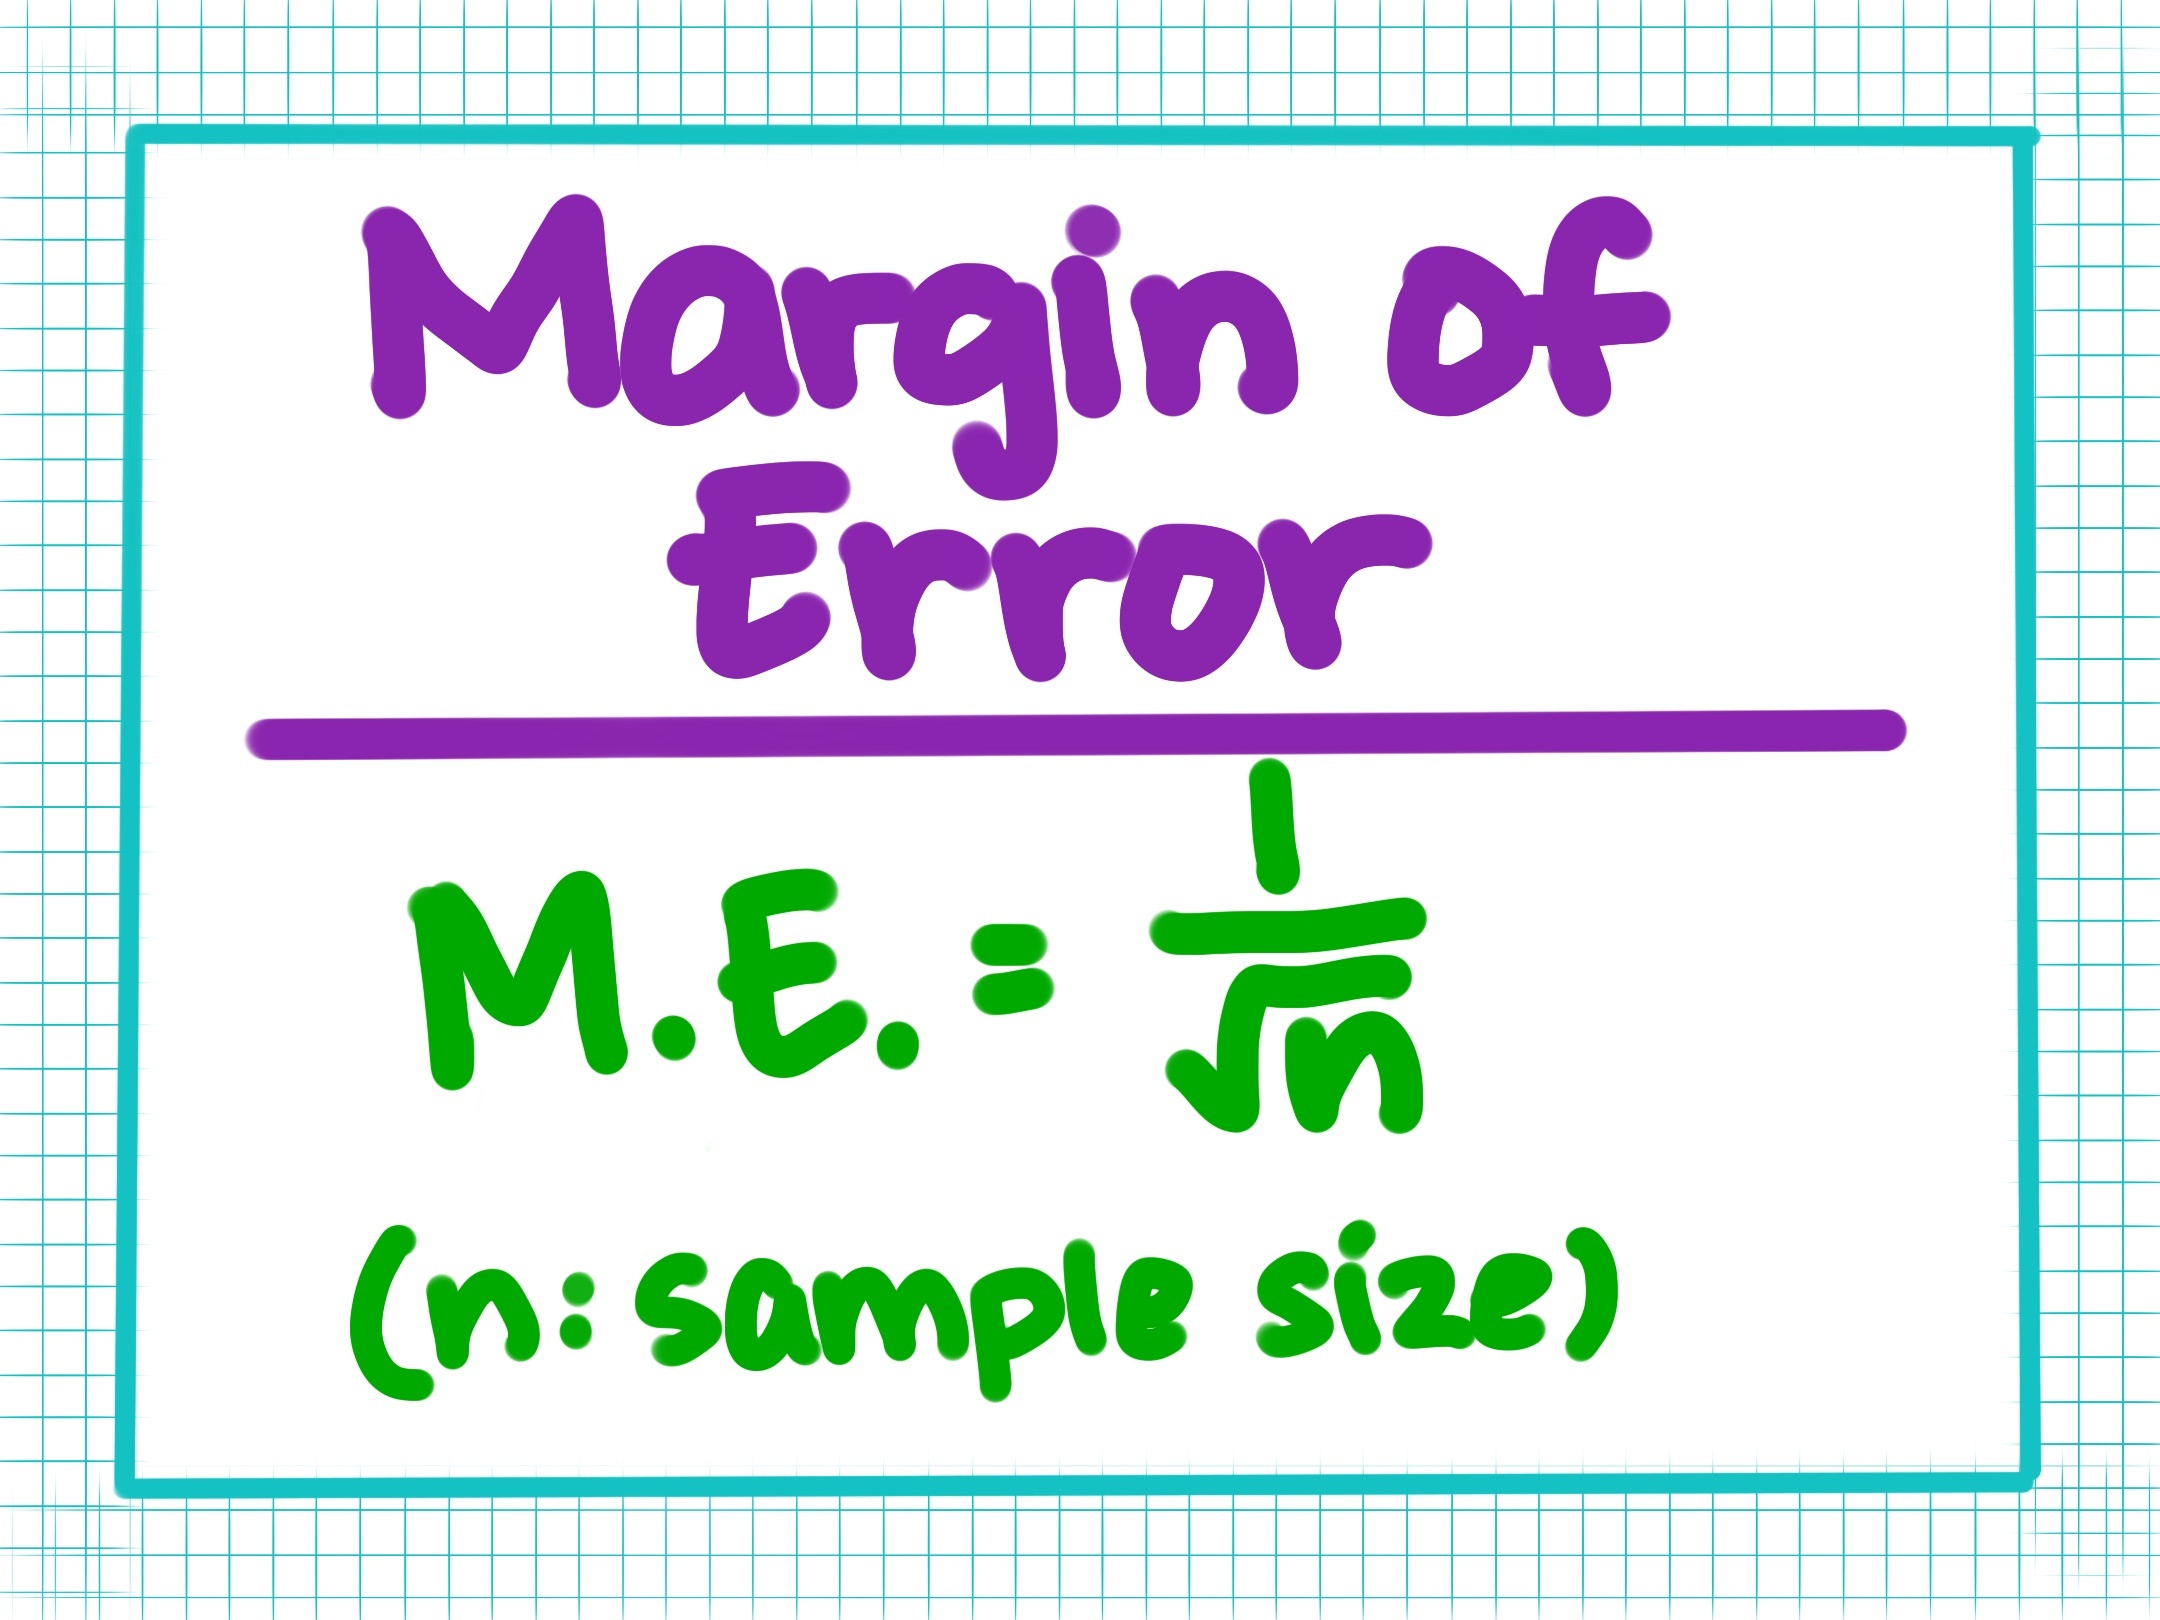
The formula for the margin of error (where nn = sample size):

1n\frac{1}{\sqrt{n}}

As the sample size increases, the margin of error decreases. We can see this principle represented in the equation, but also because as the sample size increases, the variability decreases.

Oftentimes, people will ask for the true population interval, which means they typically want the sample mean ±\pm the margin of error.

Let's work through the example problem in the video!

Out of 1,000 people surveyed, 63% of them prefer Coke over Pepsi. Find the margin of error and true population interval.

Using the equation, we can solve...

Margin of error = 11000=0.032=3.2\frac{1}{\sqrt{1000}} = 0.032 = 3.2%

To find the true population interval...

63% ±\pm 3.2%, which is the same as 59.8% and 66.2%.

Therefore, the true population interval is 59.8% - 66.2%, with the margin of error included.

Try the next two sample questions in the video!

Illustrated · 1 min

Margin of Error‾\underline{\textbf{Margin of Error}}

A margin of error\textit{margin of error} is the amount by which your obtained results could differ from the actual representation in the population. For example, a 55% margin of error tells us that our statistic is within 55% of the actual population representation.

Calculate Margin of Error‾\underline{\textbf{Calculate Margin of Error}}

To calculate the margin of error we use this formula: margin of error\textit{margin of error} = z⋅σnz\cdot \dfrac{\sigma}{\sqrt{n}}

Where zz is the critical value, σ\sigma is the standard deviation, and nn is the sample size

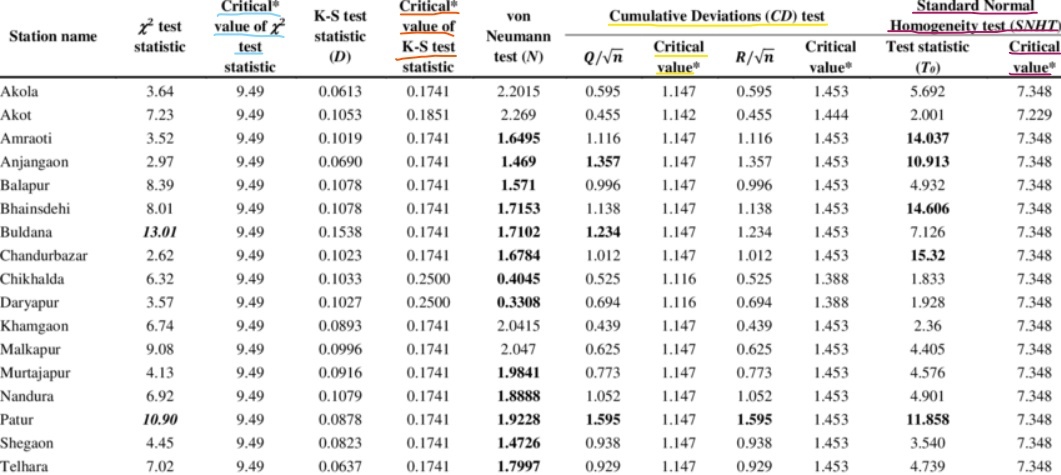
  • The critical value\textbf{critical value} is the cut off value beyond which there is an unlikely chance that the real value of the statistic for the actual population lies there. Critical values depend on distribution or test used and there are typically charts from which you can determine the critical value. The table below is an example of a critical value chart that you might see.
  • Sample size\textbf{Sample size} the the the size of the portion of the population that is chosen for the experiment. For example, out of the total population of Pennsylvania, we could take a sample of just the population of Pittsburgh and so in this case our sample size would be the population number of Pittsburgh.
Example critical value table

Image source: ResearchGate

Illustrated · 1 min

Margin of Error

The next lesson in our series of statistical tests is about the margin of error.

Margin of Error

Image source: by Anusha

The margin of error is a statistical test that tells you the random sampling error in a dataset. A smaller margin of error typically indicates more confidence that a poll result reflects the entire population. For example, if a researcher using survey data finds a poll result that 47%47\% of a sample prefers chocolate ice cream over vanilla ice cream, with a margin of error of 22 percentage points, we know that there is a 2%2\% chance of error in the online survey.

We see margins of error is most statistical analysis environments, including social science research, other science research, and market research. Overall, the goal is to reduce the margin of error. We can do that through strong research techniques.

Type a concept, like “slope” or “photosynthesis”.

↑ ↓ to choose · Enter to openSearch explanations and problems