Illustrated · 4 min

+2 contributors


Visualizing Skew Using a Graph
The skewness of a graph is simply a way of describing the shape of a distribution. Before explaining some of the details, we can gain a visual intuition for what skew is:

made using Desmos
So, when looking at a graph of the distribution, see which side of the graph has more of a "tail", and that will be the direction of the skew. The "tail" side is longer! This might seem a little weird, since the left skew graph seems to be leaning to the right and vice versa for the right skew graph. Remember that skew refers to where the tail of the graph is, not where datapoints are.
Note: Left skew is also known as negative skew and right skew is also known as positive skew. Keep this in mind if you read stuff online about skew.
Understanding What a Tail Is
A "tail" of a graph is a very visual concept. Essentially, a tail refers to the part of a graph of a distribution which tapers off on one side.
Looking back at the graphs from above, we can see that the graph on the right has a long section (from around onwards) where the graph tapers off. This is what we refer to as a tail. So for the graph on the right, the tail is on the right.
Looking at the leftmost graph, we see the graph tapers off to the left (starting at around ).
See below for the same graphs but with the tails of the left and right graphs circled in

made using Desmos
Effects of Skew on Measures of Central Tendency
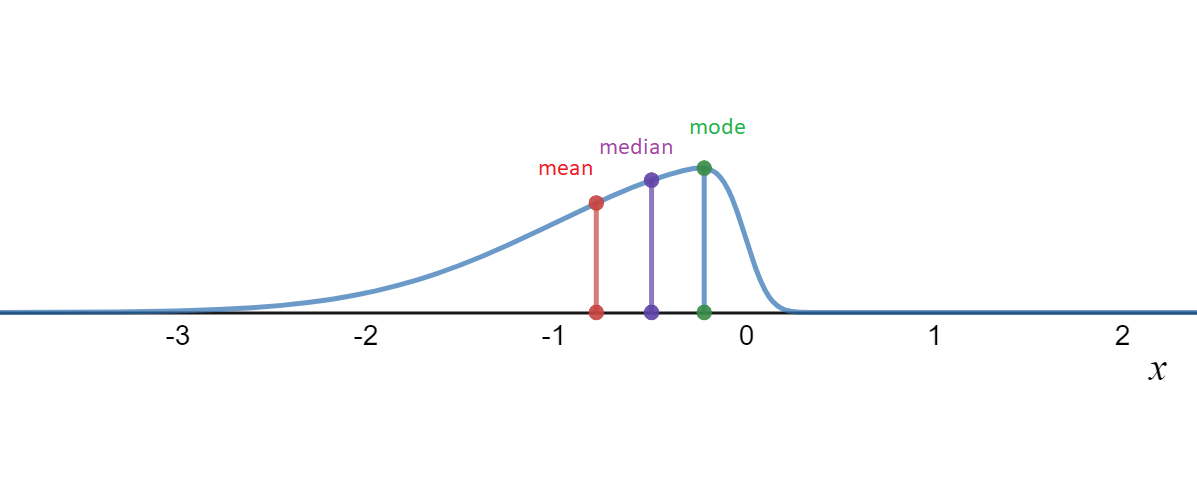
Now, let's use our Measures of Central Tendency and plot the mean, median, and mode of graphs which have left or right skew.

made using Desmos
You may have noticed in the graph that when there is left skew, the mean is to the left of the median/mode while with right skew, the mean is to the right of the median/mode. This will almost always be true of left and right skewed graphs.
If you're curious about cases where these rules don't work, try checking out the Binomial Distribution. For some values, the binomial distribution has the same mean, median, and mode but still has left skew!
There is a more specific way to measure how skewed a distribution is, called Pearson's moment coefficient of skewness, but it is quite advanced. For now, focus on finding the tail of the distribution. If there is no information on where the tail of the distribution is, try using the mean, median, and mode to determine skew.
Visualizing Skew with Box and Whisker Plots
Another common way of visualizing distributions is Box and Whisker Plots. As mentioned earlier, we can use multiple ways to measure the skew of a distribution. One way to do so is using Quartiles. We can say a distribution is left skewed if while a distribution is right skewed if .
This might not make much sense with a bunch of variables, so we can demonstrate it visually using box plots:

made using Desmos
Now, is the size of the left rectangle while is the size of the right rectangle. In this case, we would say the distribution is left skewed.
A good way of remembering this rule is that a distribution is left skewed if the left rectangle is bigger than the right while the distribution is right skewed if the right rectangle is bigger than the left.
Sometimes, box plots are made vertically. In this case, right skew corresponds to the upper rectangle being bigger while left skew corresponds to the bottom rectangle being bigger.
Now, a natural thing to wonder is if all these ways of measuring skew are the same. If the box plot looks left skewed, then the mean might be less than the median/mode... Think about this for a little while then continue.
The answer is no! We can see this by looking at the data . The mean of this data is , the median is and the mode is (try to verify this yourself!). Now, let's look at the box plot:

made using Desmos
Notice that the left rectangle is bigger than the right triangle. So this indicates left skew. However, we already saw that the mean, median, and mode are all the same, which indicates no skew! This is very important since it shows that the way we measure skew determines if a distribution is skewed or not.
Summary
In general, here are some rules for determining the skew of a distribution:
-
If you get a graph of a distribution, look for the tail of the graph to determine skew.
-
If you get a box plot, look for which rectangle is bigger to determine skew.
-
If you have only the data, try making a box plot/graph and using that to determine skew.
-
If none of these methods are working, compare the mean, median, and mode to determine skew.