Interactive · 1 question

3 Sigma Rule

Also known as the "empirical rule," the 3 sigma rule provides a quick way to analyze data that follows a normal distribution.

What it entails:

  • 68% of the observations fall within σ of the mean μ
  • 95% of the observations fall within 2σ of the mean μ
  • 99.7% of the observations fall within 3σ of the mean μ

The weights of clementines in a box of a local supermarket follow a normal distribution with mean 80 grams and standard deviation 5 grams. The percentage of clementines having weights between 72 and 88 grams must be

Choose one answer

Video · + 1 min read

(Video) The Normal Distribution and the 68-95-99.7 Rule

by patrickJMT

In this video by patrickJMT, you can learn about the normal distribution and the 68−95−99.768-95-99.7 rule.

Summary

This video walks you through the normal distribution and the 68−95−99.768-95-99.7 rule, which helps us to understand how data is spread around the mean.

In a normal distribution, 6868% of the data falls within one standard deviation of the mean, 9595% falls within two standard deviations, and 99.799.7% falls within three standard deviations. For example, when looking at IQs, there is a mean of 100100 and a standard deviation of 1515. You can use the 68−95−99.768-95-99.7 rule to find the values that are one, two, or three standard deviations from the mean.

We can extend this to finding the percentage of data above or below a certain value. For example, about 5050% of IQ scores are above the mean, about 1616% are below one standard deviation from the mean, and about 0.150.15% are above three standard deviations from the mean.

The 68−95−99.768-95-99.7 rule works with a bell-shaped, symmetric distribution and helps you estimate how much data falls within different numbers of standard deviations from the mean.


Illustrated · 1 min

The Three Sigma Rule

We know that a normal distribution is a data pattern that looks like a bell-shaped curve. The mean, μ\mu, is at the center of the curve. The standard deviation tells us how far data values tend to be from the mean.

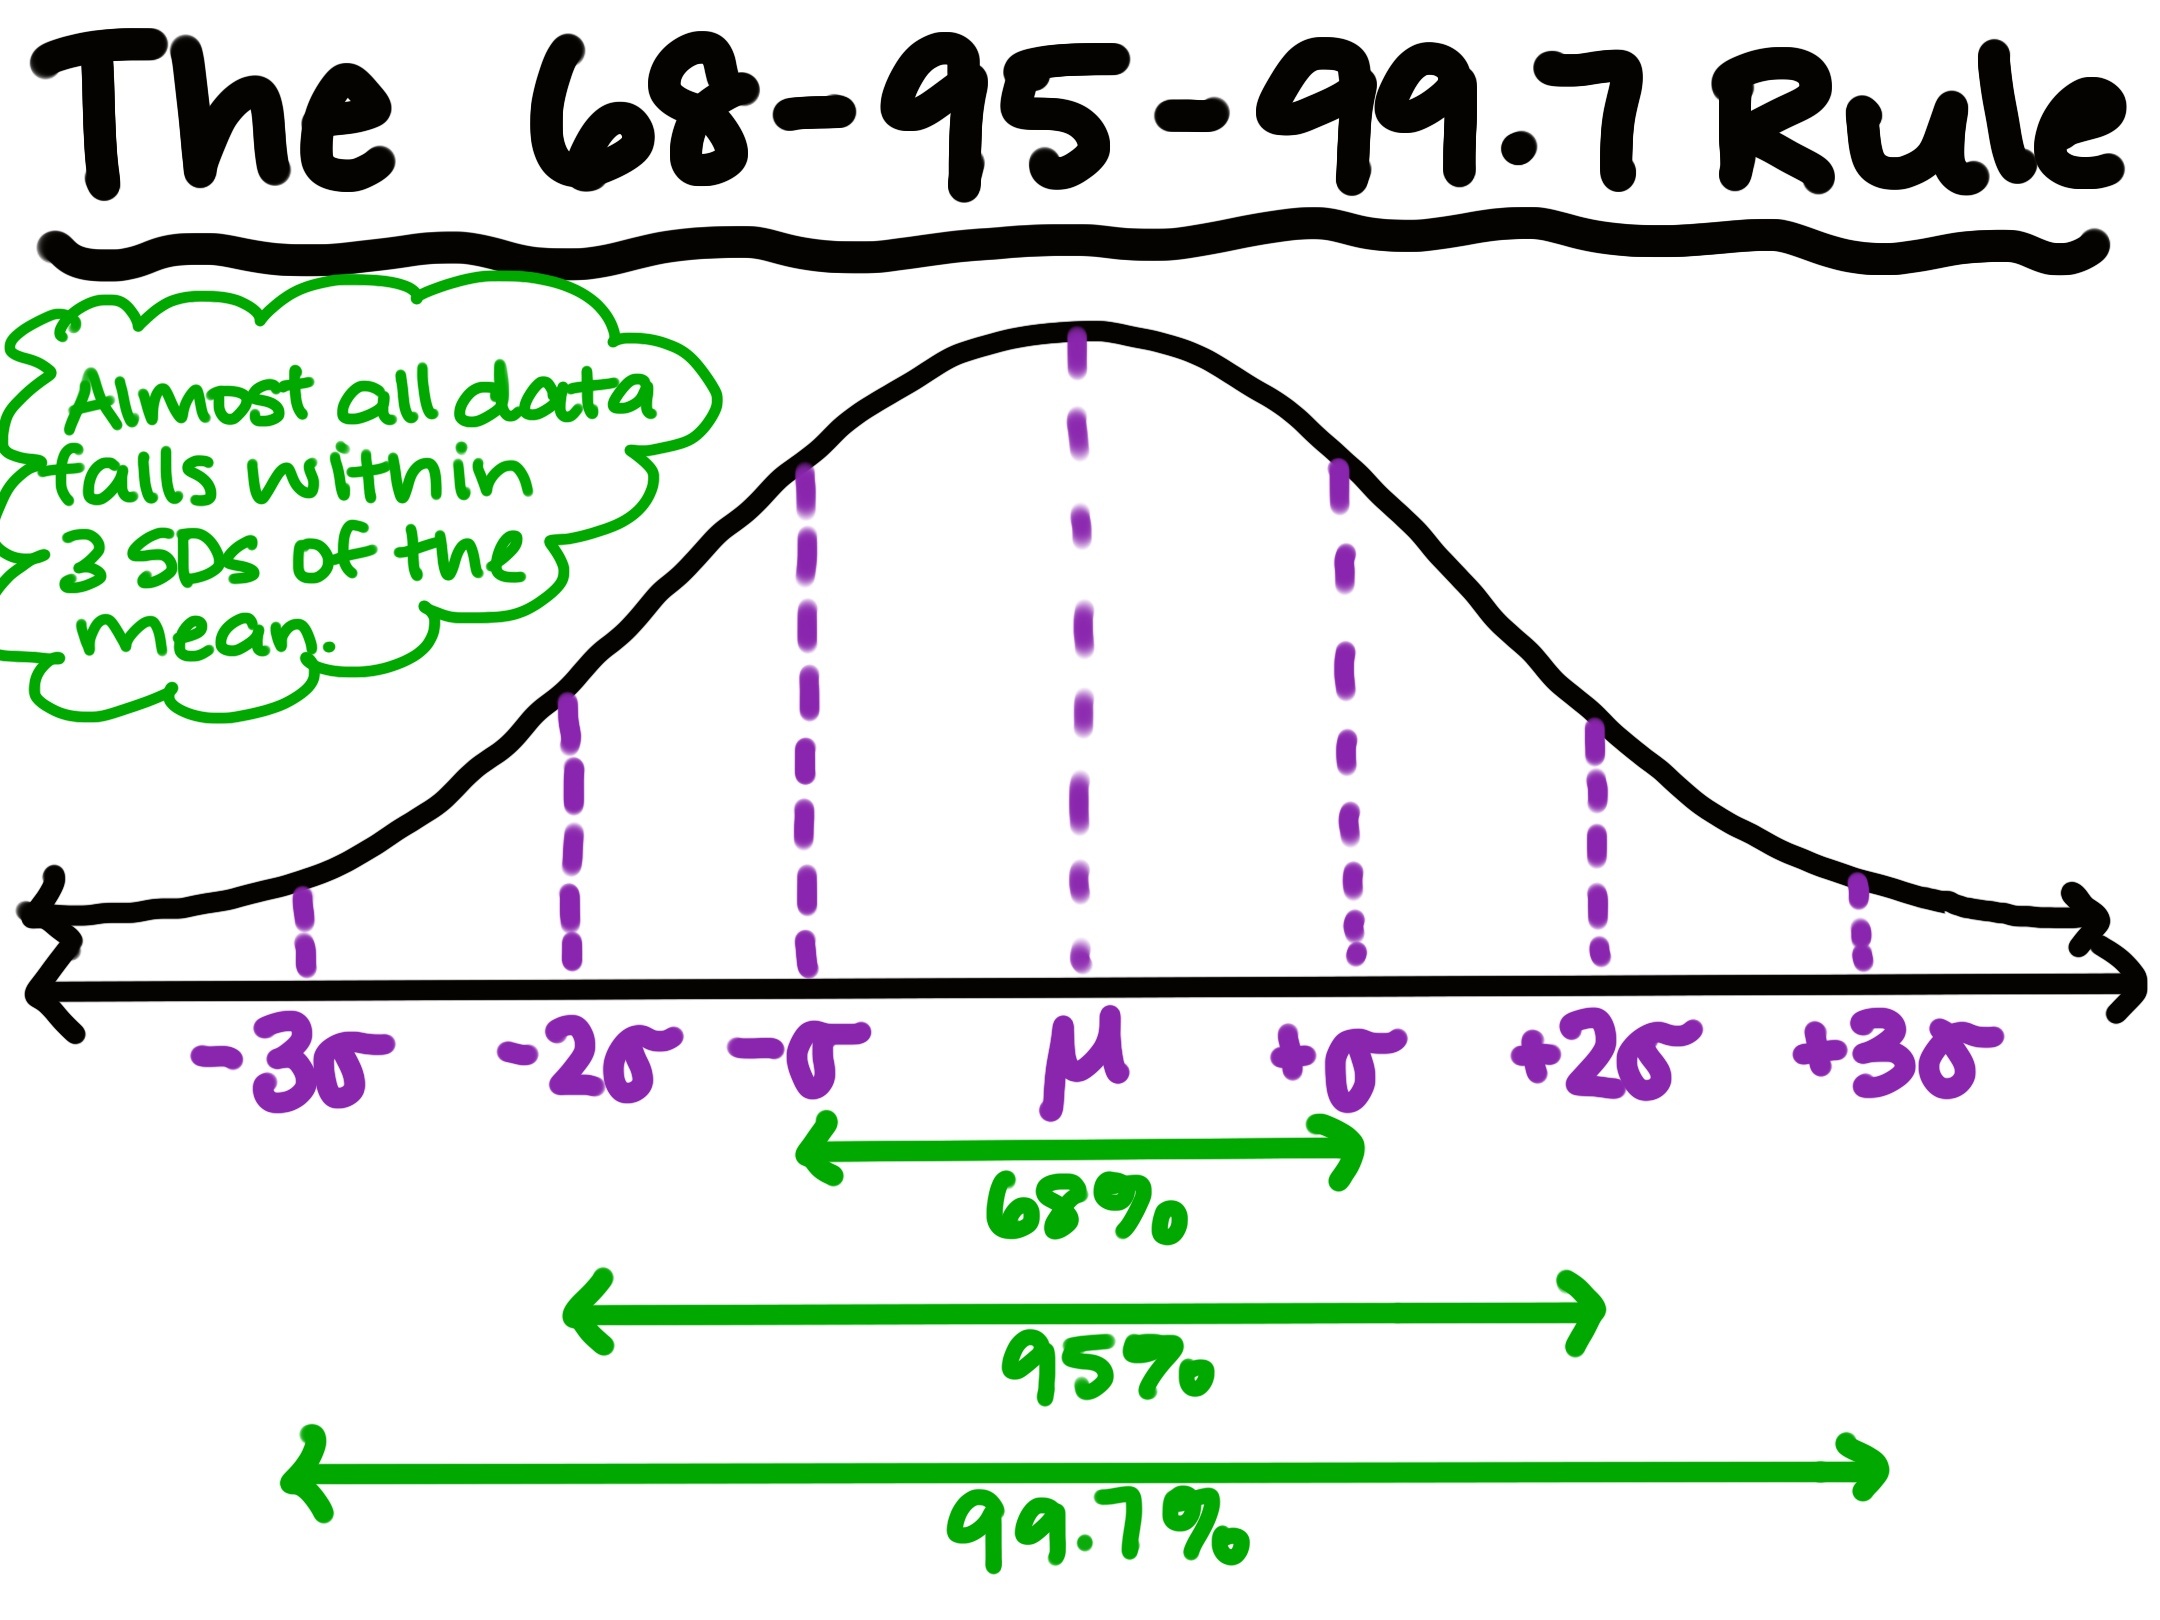
The 68-95-99.7 rule: almost all data falls within 3 SDs of the mean.

Image source: by Anusha Rahman

The 3Sigma3 Sigma rule, also known as the 68−95−99.768-95-99.7 rule, helps us to understand where most data values fall.

About 6868% of the data is within one standard deviation of the mean. About 9595% of the data is within two standard deviations of the mean. And About 99.799.7% of the data is within three standard deviations of the mean.

This means that very few data values are more than three standard deviations from the mean. The rule is useful for understanding the spread of data in a normal distribution.

Read · 1 min

The Three Sigma Rule

The 3 sigma rule is a rule that helps us understand how data is spread out in a data set. It is also called the 68-95-99.7 rule or the empirical rule. The empirical rule states that data will fall within certain distances from the mean when the distribution is bell shaped. A bell-shaped distribution is also called a normal distribution. We've learned that before!

The rule is based on the number of standard deviations from the mean. About 6868% of the data will fall within one standard deviation of the mean. Approximately 9595% of the data will fall within two standard deviations. About 99.799.7% of the data will fall within three standard deviations.

This pattern is why the rule is called the 68−95−99.768-95-99.7 rule. The distribution is symmetric, so the data is spread out in a similar way on both sides of the mean. We can also use the area under the curve to show these percentages. For example, the area within three standard deviations represents about 99.799.7% of the data.

The rule can be useful for data such as IQ scores, which are often modeled with a bell-shaped distribution. It gives us a quick way to estimate how much of the data should be near the mean. However, the rule does not work well for every data set. It is mainly used when the distribution is approximately bell shaped and symmetric - so, the data must follow a normal distribution.

The 68−95−99.768-95-99.7 rule comes from empirical research about normal distributions. It is often used as a rule of thumb when we want a quick estimate. For data that is not bell shaped, Chebyshev's theorem can give us a more general way to describe how much data will fall near the mean. Understanding the 33 Sigma Rule will help you work with normal distributions and understand how standard deviation describes the spread of data.

Type a concept, like “slope” or “photosynthesis”.

↑ ↓ to choose · Enter to openSearch explanations and problems